HDT Fact Book 2023: Fatal Accidents, Driver Abilities Among Key Safety Concerns
With a 49% increase in the number of truck-crash fatalities over the past decade, DOT-recordable accidents per million miles of travel is an important metric for fleets. In addition to that concern, fleet safety managers say their biggest challenges are staying up to date with regulatory changes and improving driver knowledge and skills.
Get a snapshot of key trucking-safety issues and learn about the current safety statistics.
Source: Canva/HDT Illustration
4 min to read
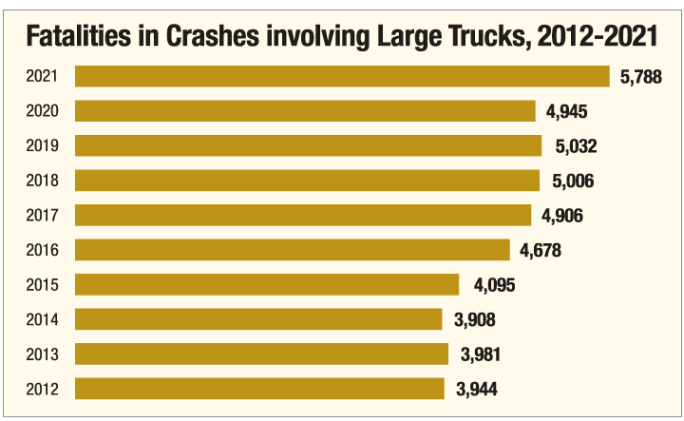
The number of fatalities in crashes involving medium- and heavy-duty trucks jumped in 2021 (the most recent numbers available) after the COVID-19 pandemic contributed to a drop in 2020. At 5,788, fatalities were up 17% from the previous year. That’s according to the Department of Transportation’s Fatality Analysis Reporting System (FARS), which defines “large trucks” as any medium- or heavy-duty truck with a gross vehicle weight rating greater than 10,000 pounds, commercial and non-commercial.
Ad Loading...
That was one of the trucking industry's primary safety concerns in 2023. Learn about this year’s top issues related to trucking safety, as detailed in the HDT Fact Book 2023, HDT's annual snapshot of where the trucking industry is, where it's been, and what its current long-term trends are.
Fact Book 2023: HDT's annual snapshot of where the industry is, where it's been, and long-term trends.
According to the National Safety Council, there has been a 49% increase in the number of truck-crash fatalities in the last 10 years. NSC reports the involvement rate per 100 million truck miles traveled is also up — 7% from 2020 and up 22% in the last 10 years.
Ad Loading...
Between 2012 and 2021, DOT numbers indicate that about one-fourth of the fatal large-truck crashes were on interstate highways. The remainder were non-interstate.
Looking at geography, between 2012 and 2021, North Dakota had the highest percentage of large trucks involved in fatal crashes, at 19.4%. Wyoming came in second at 18.8%.
Smallest percentage? Hawaii at 4%, DC at 4.2%, and Rhode Island at 4.8%.
81% of fatal crashes involving large trucks were multi-vehicle, and 72% of the fatalities were occupants of other vehicles.
Source: FARS
Metric to Watch: DOT-Recordable Accident Rates
DOT-recordable accidents per million miles of travel is an important metric for fleets, because it’s one of the things the FMCSA considers during a compliance review to decide a carrier's safety rating.
The industry average accident rate for most carriers is 0.74 accidents per million miles, according to Trucksafe.com. A carrier with an accident rate of more than 1.5 accidents per million miles (for non-urban carriers) or 1.7 accidents per million miles (for urban carriers) over the course of a 12-month period will fail that portion of the audit, which could lead to a downgraded safety rating.
Ad Loading...
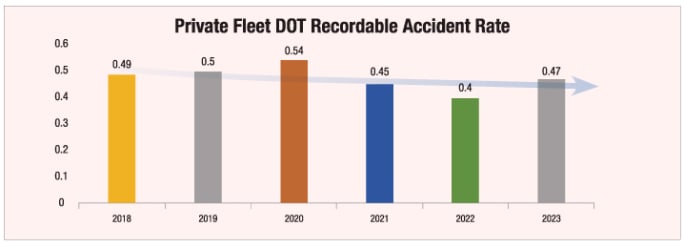
Private fleets participating in the National Private Truck Council’s annual benchmarking survey continue to report an outstanding safety record. In this year’s survey, private fleets reported 0.47 recordable accidents per million miles, up from last year’s all-time low of 0.4.
For five of the last six years, the crash rate among private carriers has come in at 0.5 accidents per million miles of travel. Source: National Private Truck Council
Source: NPTC
Fleet Safety Manager Challenges
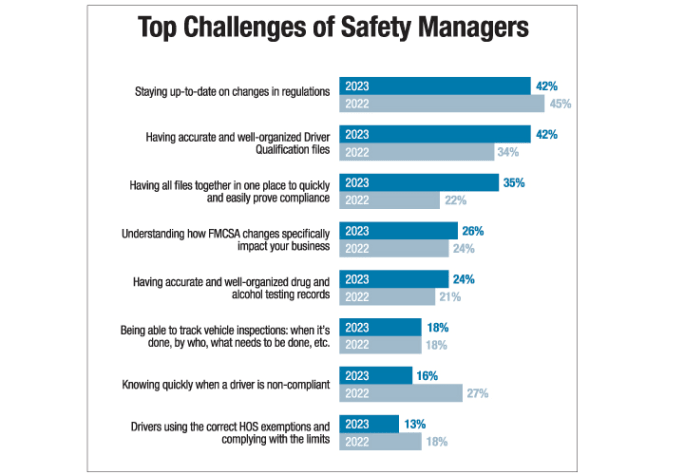
Among fleet managers' biggest challenges are staying up to date with regulatory changes and improving driver knowledge and skills, according to a recent survey.
The State of Fleet Management: Insights on Priorities for Today’s Fleet Managers is based on a survey fielded in February 2023 and is the third such study conducted by the J.J. Keller Center for Market Insights, the research arm of J.J. Keller & Associates. Survey respondents are trucking fleets, both for-hire and private. In terms of size, 67% were less than 25 trucks, 17% were 25-99 trucks, and 17% were 100+ trucks.
Two challenges rose in importance from last year:
Knowing quickly when a vehicle or trailer is damaged or non-compliant jumped 24% from 2022.
Having all driver files together in one place so fleet managers can quickly and easily prove compliance increased 13% from 2022.
Ad Loading...
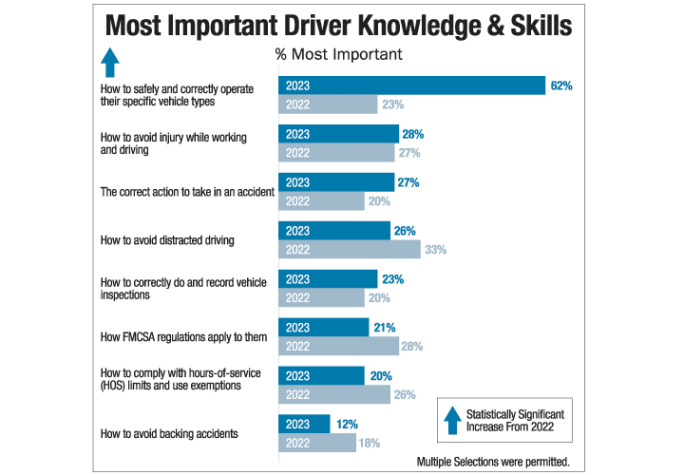
When it comes to driver knowledge, safely and correctly operating a specific vehicle type topped the list, with 62% of respondents agreeing it was the most important driver knowledge and skill. That was a 39% increase over 2022, when distracted driving was the top of the list.
This year's survey respondents were less concerned about driver distraction than last year but more concerned about drivers knowing their specific vehicle type.
Source: J.J. Keller
Fleet safety managers want to stay up to date and stay organized, but it's a challenge.
Source: J.J. Keller
Commercial Drivers and Drug Testing
The Federal Motor Carrier Safety Administration has been tracking positive drug and alcohol tests among commercial driver’s license and permit holders since 2020.
When a driver has a positive test, he or she can’t drive a commercial vehicle or other safety-sensitive functions until a prescribed return-to-duty process is completed.
In a Clearinghouse snapshot as of June 1, 2023, out of more than 191,000 drivers that had at least one violation, nearly 136,000 were in prohibited status. More than half, 102,905, had not started the return-to-duty process, likely indicating those drivers decided to get out of trucking. About 55,500 were in non-prohibited status, having had a negative return to duty test result.
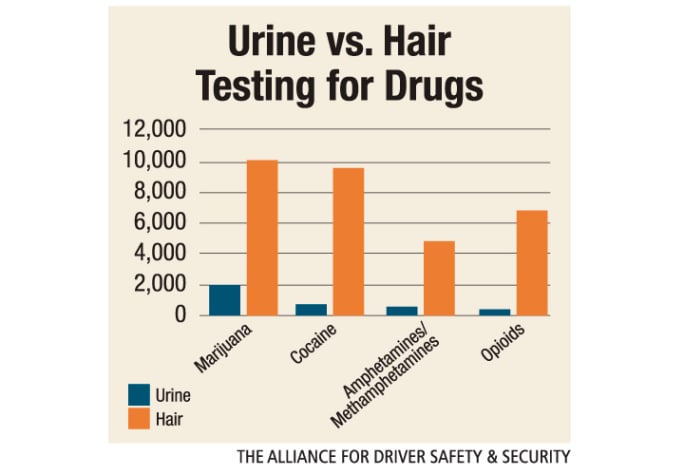
Some believe that the DOT-required urine testing far understates the real numbers. The Trucking Alliance says it’s missing 90% of the actual drug users, based on analysis of hair tests administered by its members.
Ad Loading...
When looking at hair-testing results compared to the required urine-testing, opioids moved up to the third-most-common drug found in testing.
Source: The Alliance for Driver Safety & Security
Drawing from 936,872 urine and hair drug screens administered from 2017-2022, researchers at the University of Central Arkansas found hair testing produced a 9% higher positivity rate than the DOT-required urinalysis. Hair tests uncovered:
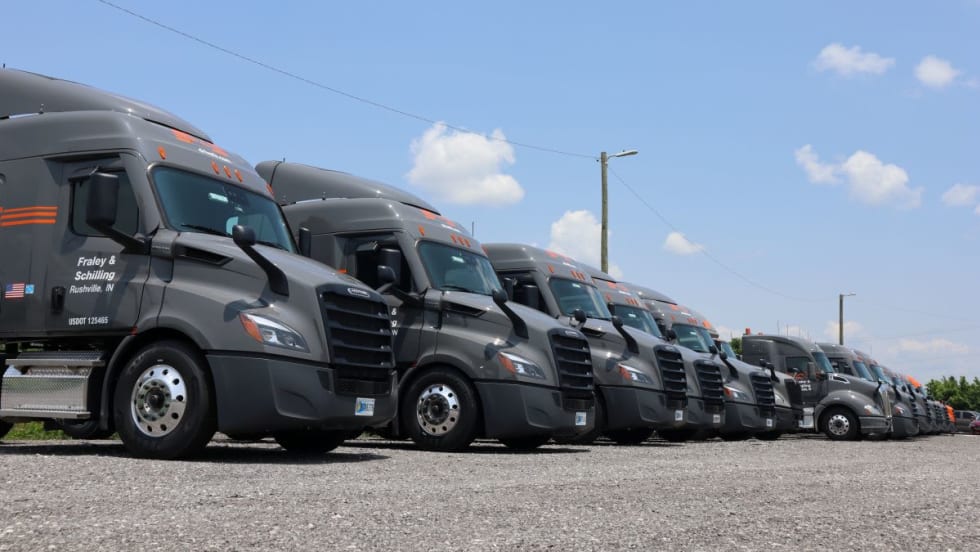
Fraley & Schilling needed a way to close a compliance workflow gap in its ELD system without adding more work from driver training, reminders, and back-office follow-ups. It found the answer in a custom driver app.
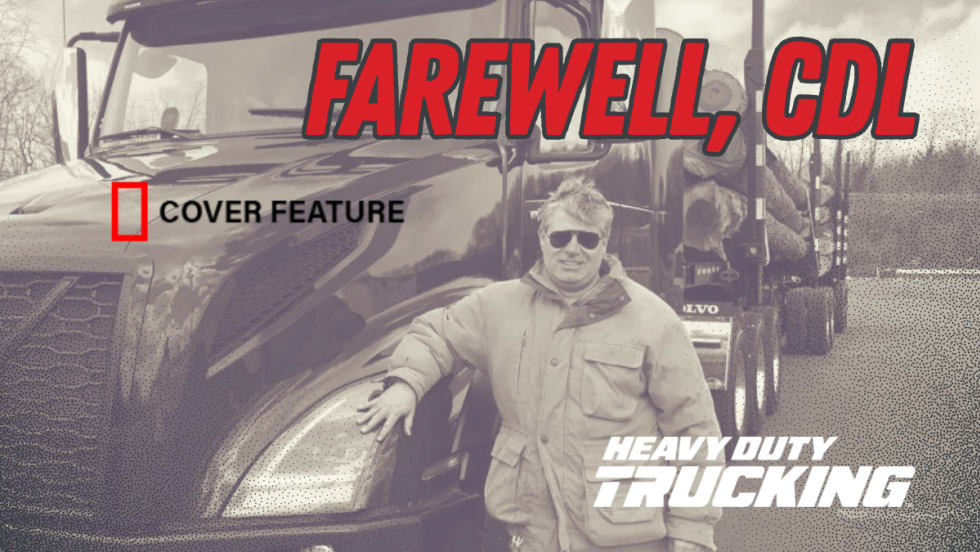
After more than 20 years as a CDL holder, HDT Executive Editor Jack Roberts is letting his commercial license expire. Not because he wants to — but because trucking's nuclear verdict crisis has made the risks of public-road test drives too great for editors, manufacturers, and everyone involved.
NMFTA researchers say dozens of registered ELDs may be built on the same software platforms, allowing compliance and security concerns to persist even after individual devices are removed from the market.
In this new study, the American Transportation Research Institute will explore how driver-facing cameras can impact safety and operational metrics in trucking fleets.
The company called the next-generation in-cab camera safety platform "a fundamental shift from systems that report on what happened to systems that actively drive what should happen next."
A new Fleetworthy-Lytx integration gives fleet managers access to video context alongside safety event data, streamlining driver coaching and incident review.