


Related: FTR: COVID-19 Crisis to Take Toll on Trucking, Economy
Interactive FTR Heatmap Shows COVID-19 Impacts on Truck Rates by State
FTR has released the COVID-19 Impact Heatmap, which assesses the state-level rate impacts by four trucking equipment types – dry van, refrigerated, flatbed, and specialized – using Truckstop.com spot market data.
April 2, 2020
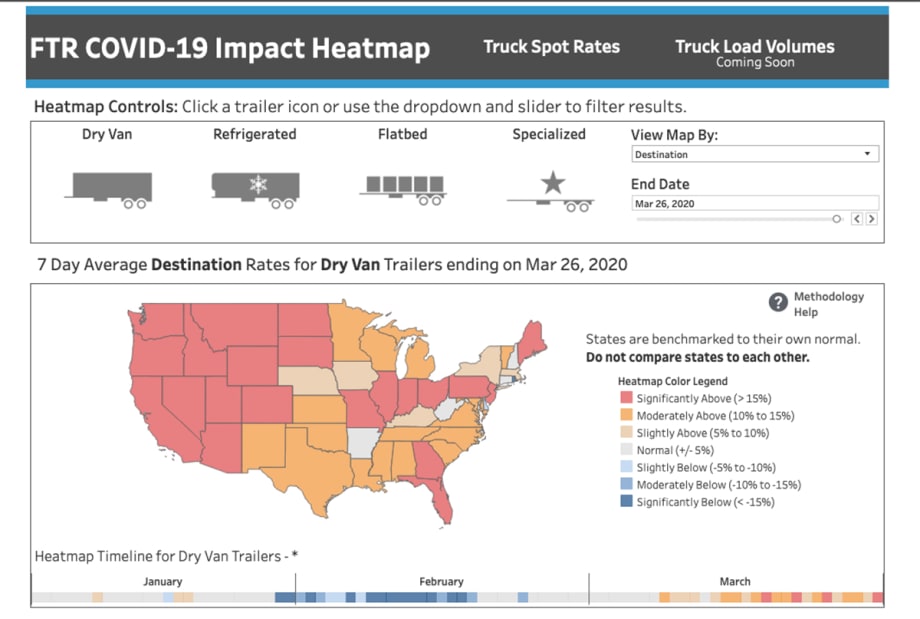
Image: FTR
2 min to read
FTR has released the COVID-19 Impact Heatmap, which assesses the state-level rate impacts by four trucking equipment types – dry van, refrigerated, flatbed, and specialized – using Truckstop.com spot market data.
Each combination of states and equipment type reflects rate trends for the states both as origins and destinations using the most recent seven days from the date selected. This publicly available map can be viewed now on the FTR website.
“Truck drivers and the companies that employ them are on the front lines of America’s response to the coronavirus crisis,” said Avery Vise, FTR vice president of trucking. “Trying to keep up with the myriad state and local restrictions and fluctuating conditions can be overwhelming, but as markets often do, truck spot rates naturally reflect these stresses. By showing how rates in individual states deviate from what FTR assesses to be the norm absent the COVID-19 crisis, we believe we are providing a valuable analytical tool to shippers, brokers, and carriers and even to those who simply want to understand how the crisis is affecting U.S. commerce.”
FTR’s analysis examines historical seasonal behavior regarding rates in each state and normalizes the data to represent how the trucking environment would look in a typical growth economy. By comparing that norm to the current rate environment, the industry can understand how COVID-19 is affecting rates on a state-by-state basis.
The data used to create the heatmaps compare the most recent seven days to the same seven days over the last five years. This data is then compared to the last month – January – during which COVID-19 had no significant impact on U.S. transportation. Because of inherent data variations, “normal” is defined as a range rather than a specific number. The maps’ color variations indicate the degree to which rates deviate – higher or lower – from that normal range over the most recent seven days. A slider function allows the user to change the snapshot for any date to provide a seven-day lookback for any date going back to early January. This feature provides insights into how the COVID-19 impacts have changed over time.
It is important to understand that the heatmaps reflect the status of a given state’s rates compared to its own normal range. It does not indicate anything about the relative level of actual spot rate levels among states.
Following this release, FTR is scheduled to develop additional dashboards to provide greater visibility into how COVID-19 is affecting transportation. The next feature to be added to this map will show truck load volumes.
More Fleet Management
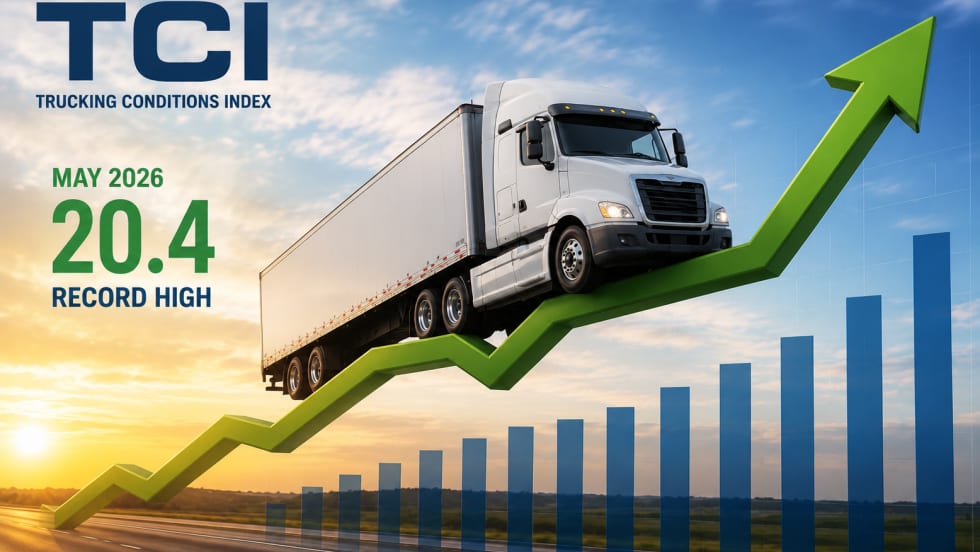
FTR Says Freight Rates Surged in May
FTR's Trucking Conditions Index surged to a record high in May, the analytics firm reports.
Read More →
Meet HDT's Truck Fleet Innovators at Heavy Duty Trucking Exchange
Heavy Duty Trucking Exchange brings fleet managers and suppliers together for the deeper conversations that lead to ideas, partnerships, and solutions. Time is running out to apply for HDTX, September 23-25.
Read More →
Sponsored•July 1, 2026
Enhance Fleet Performance with High-Efficiency Auxiliary Power Units
Drive sustainable cost savings while increasing driver comfort during short- and long-haul logistics operations.
Read More →
Sponsored•June 30, 2026
Is Your Parts Procurement Process Reactive or Proactive?
Ready to revamp your parts procurement process? Learn how now with “Strategic Parts Purchasing: A Process Checklist”
Read More →
What Trucking Events are Happening in 2026?
Looking for trucking-related conventions, expos, and other events? Heavy Duty Trucking has developed this list of national and larger regional trucking shows and events.
Read More →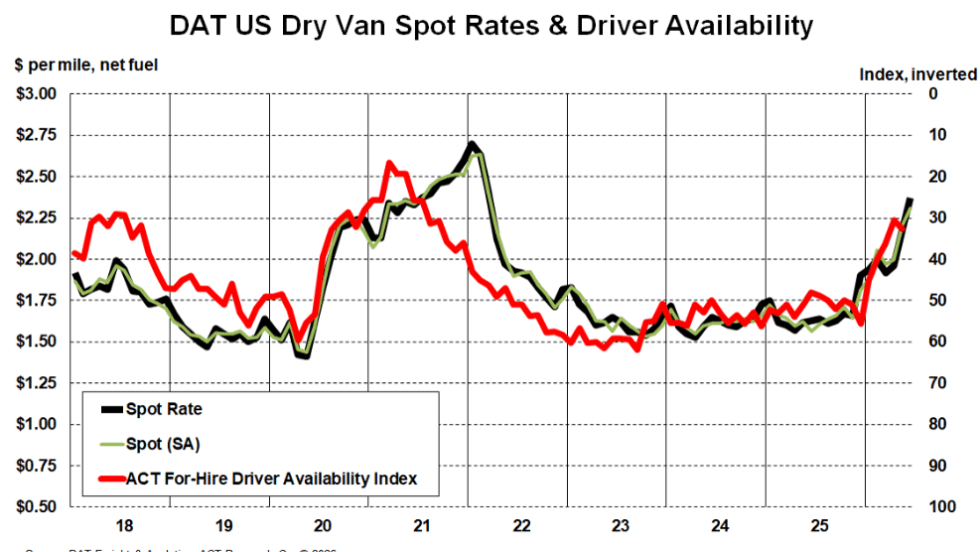
Truckload Rates Keep Rising as Tight Capacity Fuels Freight Market Recovery
Spot and contract rates continued climbing in May and June, not because freight demand is surging, but because fewer trucks and drivers are available.
Read More →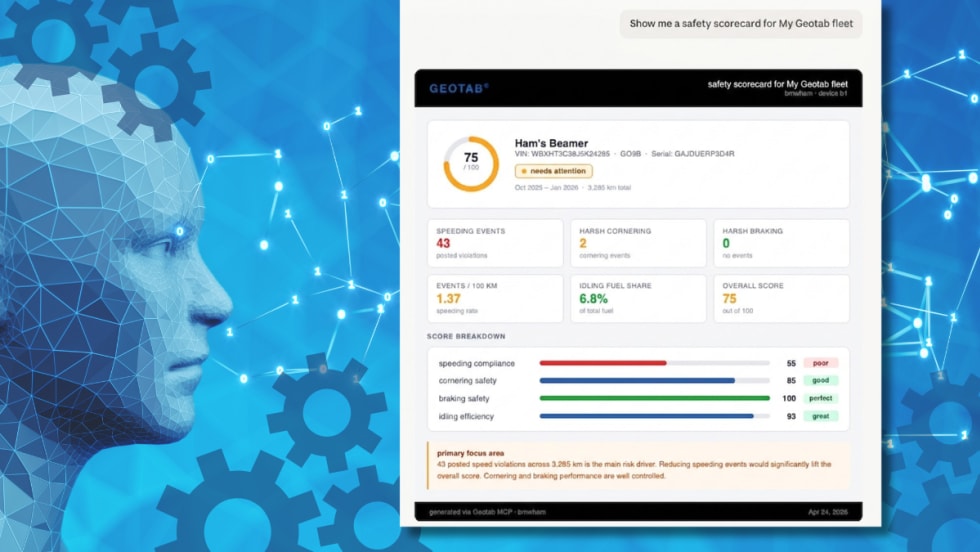
What Geotab's New AI Connector Means for Fleets
Fleets can now ask their usual AI assistants questions about maintenance, safety, fuel use, and vehicle performance, using their live Geotab data, and take action on the answers without leaving their preferred AI tool.
Read More →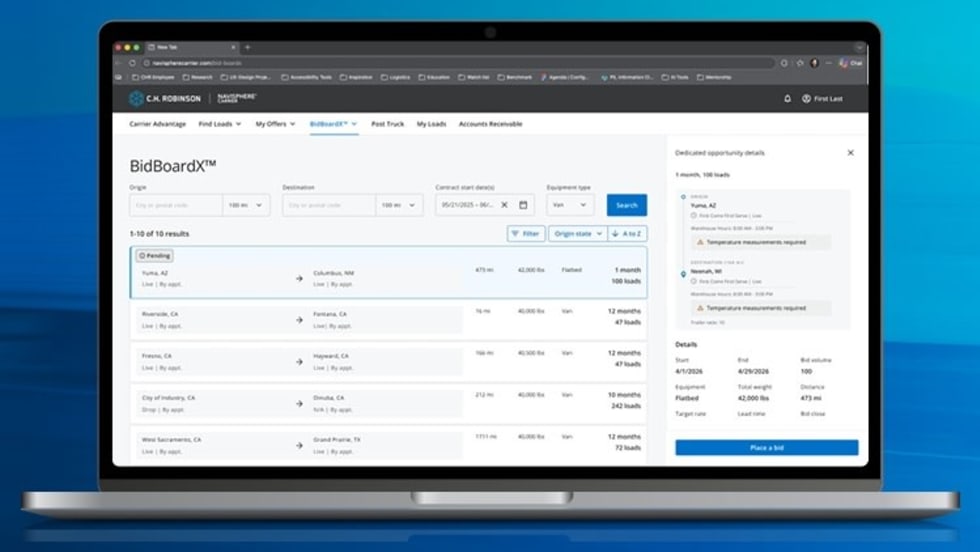
New C.H. Robinson Tool Opens Door to More Predictable Freight
BidBoardX lets carriers search, bid on, and secure committed freight opportunities through a single digital marketplace.
Read More →
New York City's Microhub Project is Delivering Results
Trucking, last-mile delivery companies, and environmental advocates like what they are seeing so far with New York's microhub program.
Read More →
Why Truck Detention Keeps Costing Fleets Time and Money
A 2024 ATRI study found detention affects nearly 40% of truckload stops and costs the industry more than $15 billion annually. Despite the toll on drivers, fleets, and supply chains, the problem remains stubbornly persistent.
Read More →