

Commentary: What Do Fleet Earnings Tell Us About the State of Trucking?
Now that fleets have reported their 2018 earnings we take a dive into the results to see what it says about the current economic state of the trucking industry.


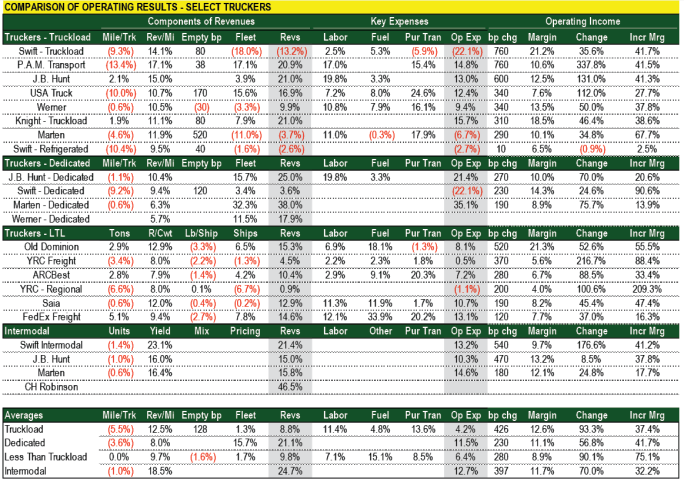
The average operating ratio for this group of truckload carriers is one of the highest we have seen since the early 1990s. Empty bp = basis points change (percentage points) in empty miles driven. Pur Tran = purchased transportation. bp chg = basis points change in operating margin. Inc Mrg = incremental operating margin.
Source: Company Reports, Tahoe Ventures, LLC Estimates
As a majority of publicly traded trucking companies have reported their fourth-quarter 2018 earnings, let’s dive in and see what the numbers tell us.
The accompanying table breaks down some of the key operating statistics revealed in trucker earnings that had been reported as of our deadline. Where carriers broke down truckload versus dedicated versus intermodal, we matched the data up as best we could. There are gaps where companies do not disclose some figures. The companies are ranked in order of the percentage point (basis point) improvement in operating margins.
In the pure truckload segment, we saw the greatest average improvement in operating margins, 426 basis points, driven by 8.8% revenue growth. Fleets grew by an average of 1.3%, with 12.5% higher revenues per mile offsetting a 5.5% decline in miles driven. That decline we attribute to changes in length of haul, as well as carriers shuttling trucks out of the over-the road divisions into dedicated truckload.
Swift Truckload and PAM Transport took top honors for improving the bottom line at 760 basis points year over year. The 12.6% average operating margin (87.4% operating ratio) for this group of truckload carriers is one of the highest we have seen for the industry, going back to the early 1990s.
More and more companies are breaking out dedicated truckload, so we did that here. Although data is not good on the expense side, there are some interesting observations. Average revenue growth for these four carriers’ dedicated operations was 21.1%, almost 150% more than the truckload group, with an average operating margin of 11.1% – a 230-basis-point improvement over the 8.8% margins reported a year ago. Fleet growth was 15.7%, so this is where all the trucks are going. Because of the short-haul nature of dedicated operations, it is not surprising that miles per truck declined by 3.6%, and we note that the 8% average improvement in yield did trail all other areas we measured. Top honors here went to J.B. Hunt’s dedicated division, improving margins by 270 basis points.
In the less-than-truckload space, we saw almost 10% revenue growth, with flat overall tonnage growth, and nearly 10% improvement in revenue per hundredweight (yield statistic). Top honors this quarter were driven by Old Dominion, which reported a 570-basis-point improvement in operating margins, driven by an industry-leading 15% revenue growth rate. What is interesting is that labor costs in the LTL group rose only 7.1% versus the 11.4% increase in truckload, but fuel costs were materially higher. Similar to truckload, the 8.9% average industry profit margin (91.1% operating ratio) is one of the healthiest we have ever seen on an industry basis.
Lastly, we have broken out the intermodal divisions of the companies who have reported thus far, and we see that intermodal profits rose an average of 397 basis points. Top honors this quarter go to Swift’s intermodal division, which reported a 570-basis-point improvement in operating profits. Surprisingly, intermodal loads were down 1% on average.
Our net takeaway? The industry is reporting some of its best profits on record, but much of this is the result of atypical industry pricing. Volume is not growing meaningfully on an aggregate industry level, which may be more a function of disciplined capacity additions, creating a shortage of capacity, resulting in the higher prices. While we expect these tight conditions to ease as 2019 moves along, this situation is unlikely to change quickly.
Jeff Kauffman has been a recognized transportation authority for almost 30 years, most notably heading freight transportation research for Merrill Lynch. Currently he is managing director for Loop Capital Markets and also heads Tahoe Ventures, a transportation consulting company. He can be reached at jkauffman@truckinginfo.com.
More Fleet Management

How Innovative Trucking Leaders Turn Change Into an Advantage
As the pace of change accelerates in trucking, the fleets that adapt best have more than the latest technology. They have cultures that embrace improvement.
Read More →
Freight Broker Bonds Just Got Harder to Get. Here's What That Means for Your Fleet.
When it gets harder for a freight broker to prove they are financially sound, the ones who cannot clear that bar get pushed out of the market. And those are exactly the brokers who used to leave motor carriers holding the bag.
Read More →
Long-Awaited Canadian Border Bridge to Open in Detroit
For trucking, the bridge opening should offer immediate improvements in efficiency and reliability, with new customs facilities, expanded inspection capacity, and direct freeway-to-freeway connections.
Read More →
Aurora Rolls Out Next Generation of Driverless Trucks for Commercial Freight
Aurora's latest autonomous trucks it's rolling out with International feature lower-cost hardware designed for a million miles as the company expands commercial driverless freight operations across the U.S. Sun Belt.
Read More →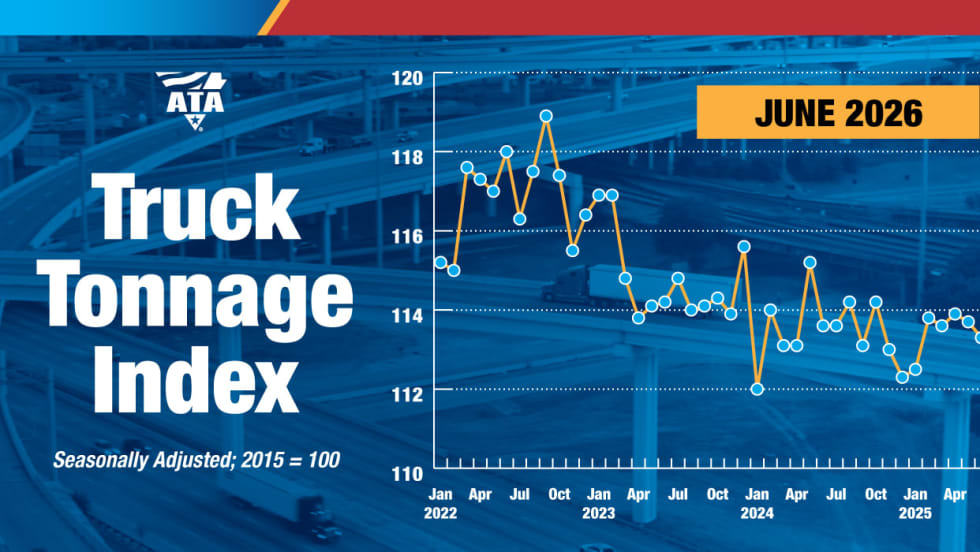
Freight Tonnage Down, Rates up, as Lower Capacity Powers Trucking Recovery
The recovery from the freight recession continues to be driven by reduction in capacity rather than by increased demand.
Read More →
Think Your Trucking Fleet Isn't Using Much AI? Think Again
Shadow AI — the use of unauthorized artificial intelligence tools at work — is becoming increasingly common, putting sensitive company data at risk. Learn how trucking fleets can protect sensitive data while embracing AI.
Read More →
ArcBest Consolidates Brands, Cuts Workforce
The company will bring three business units under the ArcBest brand, eliminate about 2% of positions, and expects the changes to generate $40 million in annual savings.
Read More →
Trucking Fleets Faced Record Operating Costs During Third Year of Freight Recession
ATRI's annual operational cost report shows carriers trimmed fleets, delayed equipment purchases, and ran older trucks as expenses continued to outpace freight rates.
Read More →
Michelin Adds AI Assistant to MyConnectedFleet Platform
Michelin’s new generative AI tool delivers instant fleet insights, helping managers analyze fuel use, tire maintenance, vehicle status, and operational performance without manually creating reports.
Read More →
LytxOne Platform Now Features AI, Compliance, and Asset Tracking Tools
New enhancements add AI-powered insights, asset tracking, compliance automation, and configurable privacy controls to Lytx's all-in-one fleet management platform.
Read More →