


Related: What Tonnage, Carloads and PMI Mean for Freight Demand
Where Are We in the Business Cycle?
Stock market volatility, rising interest rates, trade wars and other factors have some wondering if we’re standing on the precipice of the next recession. But company managements echo clear sailing ahead.
December 4, 2018
A business cycle roadmap gives us insight into how long the cycle will last.
Source: Tahoe Ventures, LLC Estimates, Federal Reserve, Department of Census
3 min to read
This month, we are going to try to answer the question, “Where are we in the business cycle?”
It’s a frequently asked question right now, with many answers. Stock market volatility, rising interest rates, trade wars and other factors have some wondering if we’re standing on the precipice of the next recession. But company managements echo clear sailing ahead.
We need to look at the duration of this cycle, rates of growth, inventory levels, and the direction of acceleration/deceleration in economic activity. It also makes sense to look at growth rates of previous cycles to see if there is a terminal velocity at which economic momentum peters out.
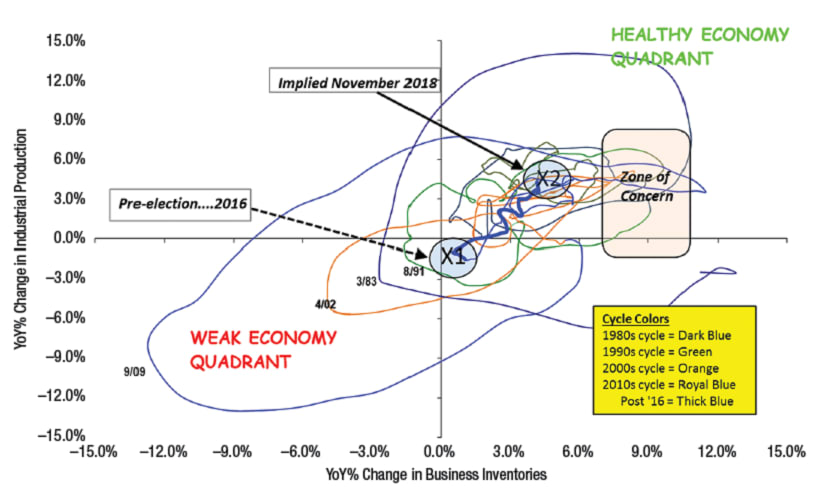
We can assess all of these factors in one chart. It may look like spaghetti, but it’s a business cycle chart — a road map of growth and momentum, showing where we have been, which direction we are headed, and how quickly. Based on the chart, I’d say we are in the 6th or 7th inning of this economic cycle, with room to grow, albeit at more moderate rates.
Most people are used to looking at growth rates on a left-to-right time chart, with each unit measuring an equal amount of time. But I believe the proper way to assess where we are in a cycle is to look at activity and inventory growth rates relative to other economic growth cycles.
To do so, we use this XY scatterplot of a three-month moving average of industrial production growth (vertical axis) versus inventory growth (horizontal axis). Generally, up (north) and to the right (east) are good (positive and accelerating momentum). Down (south) and to the left (west) are bad (slowing production or inventory liquidation).
The advantage of an XY scatterplot is you can layer cycles on top of one another. We begin in the recession of 1982-1983 (dark blue), which bottomed from a momentum standpoint in March ’83, at which point industrial production accelerated (moved north) and pulled us out of recession. The second major cycle began with the recession of 1990-1991 (green), and ended with the recession of 2001-2002 (orange). The next cycle carried us through to the Great Recession of 2008-2009 (royal blue). Each major economic cycle also includes one or two mini-cycles (these generally bottom where the X/Y axes intersect). We emerged from our most recent mini-cycle in summer 2016.
The dates in the lower left quadrant show the month/year when the recessions generally ended and growth resumed
In royal blue (bold line), we show where this most recent mini-growth cycle began, just before the 2016 election, and how growth has progressed, fueled by tax stimulus, strong global growth, and accommodative interest rates. All of those factors are fading, but the map indicates we remain on high ground.
A few points to note:
1. What matters is the direction and slope of economic activity – we remain on an upward and positive slope.
2. We are currently growing industrial production in the mid-4% range, and inventories at just less than that.
3. Gravity in industrial production growth levels tends to start at about 6% and at 7-8% or greater for inventory level, both of which we are well below. This has been consistent in the last eight large and mini economic cycles since 1980.
4. It has taken us over two years to move between the “X1” (pre-election) location to “X2” (current) location on the chart
5. We have not moved directly into a recession in any short timeframe with the growth characteristics currently being generated – 7-8% corporate profit growth, 4.5% industrial production growth, and 4% inventory growth.
Jeff Kauffman has been a recognized transportation authority for almost 30 years, most notably heading freight transportation research for Merrill Lynch. Currently he is managing director for Loop Capital Markets and also heads Tahoe Ventures, a transportation consulting company. He can be reached at jkauffman@truckinginfo.com.
Subscribe to Our Newsletter
More Fleet Management

Aurora Rolls Out Next Generation of Driverless Trucks for Commercial Freight
Aurora's latest autonomous trucks it's rolling out with International feature lower-cost hardware designed for a million miles as the company expands commercial driverless freight operations across the U.S. Sun Belt.
Read More →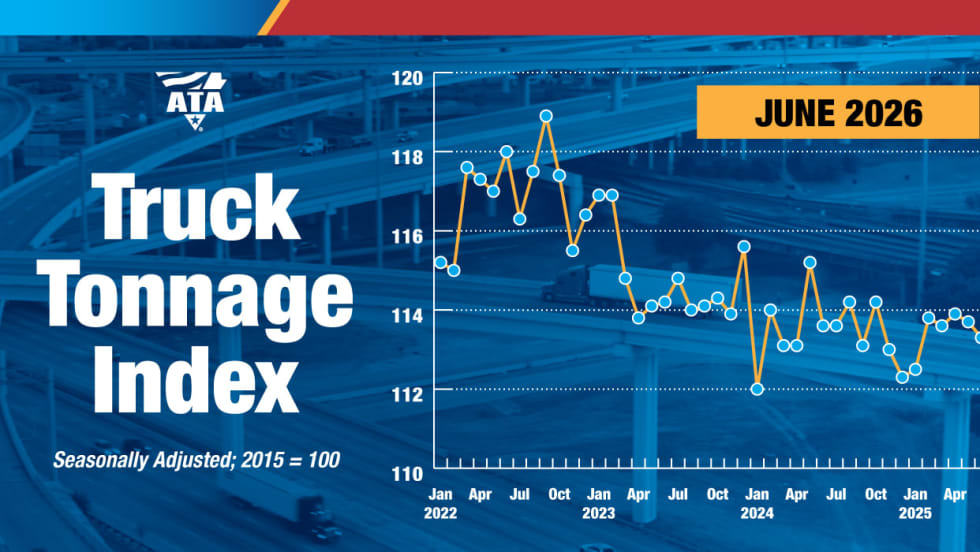
Freight Tonnage Down, Rates up, as Lower Capacity Powers Trucking Recovery
The recovery from the freight recession continues to be driven by reduction in capacity rather than by increased demand.
Read More →
Think Your Trucking Fleet Isn't Using Much AI? Think Again
Shadow AI — the use of unauthorized artificial intelligence tools at work — is becoming increasingly common, putting sensitive company data at risk. Learn how trucking fleets can protect sensitive data while embracing AI.
Read More →
ArcBest Consolidates Brands, Cuts Workforce
The company will bring three business units under the ArcBest brand, eliminate about 2% of positions, and expects the changes to generate $40 million in annual savings.
Read More →
Trucking Fleets Faced Record Operating Costs During Third Year of Freight Recession
ATRI's annual operational cost report shows carriers trimmed fleets, delayed equipment purchases, and ran older trucks as expenses continued to outpace freight rates.
Read More →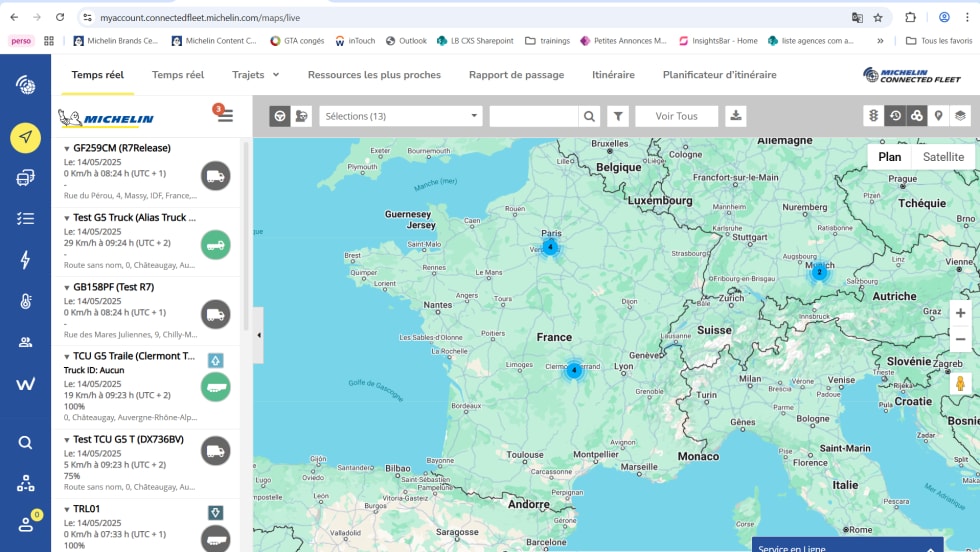
Michelin Adds AI Assistant to MyConnectedFleet Platform
Michelin’s new generative AI tool delivers instant fleet insights, helping managers analyze fuel use, tire maintenance, vehicle status, and operational performance without manually creating reports.
Read More →
LytxOne Platform Now Features AI, Compliance, and Asset Tracking Tools
New enhancements add AI-powered insights, asset tracking, compliance automation, and configurable privacy controls to Lytx's all-in-one fleet management platform.
Read More →
July Imports Poised to Set Container Record
The National Retail Federation projects July container imports will surpass the pandemic-era record as shippers frontload freight ahead of expected August tariff increases.
Read More →
HDT Announces 2026 Truck Fleet Innovator Finalists
From AI and fleet electrification to safety, operations, and leadership, these HDT Truck Fleet Innovator finalists are changing how trucking gets done.
Read More →
Van Spot Rates Top Contract Rates for First Time Since 2022
There’s more good economic news for the North American trucking industry according to the latest Truckload Volume Index report from DAT.
Read More →