

U.S. Freight Movements with Canada, Mexico Increase 4.5% Last Year
The value of freight moved between the U.S. and its North America neighbors increased 4.5% in 2014 compared to a year earlier, while over the longer term trucking has some lost market share to other transportation modes.
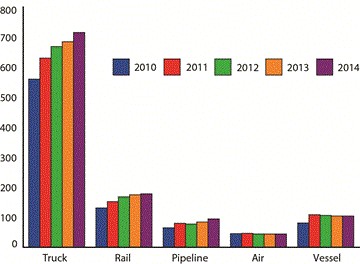
U.S.-NAFTA trade by mode: 2010-2014. Graphic: U.S. DOT

The value of freight moved between the U.S. and its North America neighbors increased 4.5% in 2014 compared to a year earlier, while over the longer term trucking has some lost market share to other transportation modes.
Four of five transportation modes – truck, rail, pipeline, and vessel – carried more U.S. freight with its North American Free Trade Agreement partners by value in 2014 than in 2013 as the overall value of freight on all modes to $1.2 trillion.
Trucking saw an increase of 4.5% last year compared to 2013, while the value of commodities moving by pipeline grew the most, 12.5%, despite a decline in cost per unit of petroleum products. Rail increased 1.5%, vessel increased 0.2%, and air fell 0.2%.

Trucks carried 59.9% of this freight and were the most heavily utilized mode for moving goods to and from both U.S.-NAFTA partners, but its share is down 3.7 percentage points from 10 years earlier. Trucks accounted for $348.7 billion of the $640.2 billion of imports, or 54.5%, and $365.9 billion of the $552.5 billion of exports, or 66.2%
Rail remained the second most used mode, moving 14.9% of all U.S.-NAFTA freight, followed by vessel, 8.7%; pipeline, 7.9% and air, 3.7%. The surface transportation modes of truck, rail and pipeline carried 82.7% of the total U.S.-NAFTA freight flows.
U.S.-Canada Freight Increases Nearly 4%
From 2013 to 2014, total U.S.-Canada freight rose 3.8%. Trucks carried 53.8% of the $658.2 billion of freight to and from the country, followed by rail, 15.8%; pipeline, 13.5%; vessel, 5.9%; and air, 4.3%. The surface transportation modes of truck, rail and pipeline carried 83.1% of the total U.S.-Canada freight flows.
According to the report, the trucking share of total freight movements with Canada has fallen 6.6 percentage points since 2004, with its imports sliding 8.8 percentage points while pipeline’s share of imports rose 8.4 percentage points and vessel exports rose 4 percentage points.
Michigan led all states in freight with Canada in 2014 with $74.2 billion. Of the top 10 states for U.S.-Canada freight in 2014, Texas had the highest percent change from 2013, a 19.2% increase.
The top commodity category transported between the U.S. and Canada in 2014 was mineral fuels, worth $148.1 billion, with 59.9% moved by pipelines. The next highest commodity category transported by a single mode in U.S.-Canada freight was vehicles and vehicle parts - other than railway vehicles and parts - with $66.9 billion in freight moved by trucks.
U.S.-Mexico Freight Up 5.5%
When 2014 is compared to the year before, total U.S.-Mexico freight rose 5.5%. Trucks carried 67.5% of the $534.5 billion of freight to and from the country, followed by rail, 13.8%; vessel, 12.2%; air, 2.9%; and pipeline, 0.9%. The surface transportation modes of truck, rail and pipeline carried 82.2% of the total U.S.-Mexico freight flows
Although trucks moved roughly two-thirds of U.S.-Mexico freight, its share of total freight decreased by 1.6 percentage points from 2004. Trucking’s share of exports decreased 4.6 percentage points from 2004 while vessel’s percentage share of exports rose 4.5 percentage points during the same time.
Texas led all states in freight with Mexico in 2014 with $192.8 billion. Of the top 10 states for U.S.-Mexico freight in 2014, Indiana had the highest percent change over 2013, a 27.4% increase.
The top commodity transported between the U.S. and Mexico in 2014 was electrical machinery at $96.6 billion with 91.5% moved by trucks. The next highest commodity category transported by a single mode in U.S.-Mexico freight was computers with $76.4 billion in freight, also moved by truck.
More Fleet Management
How Innovative Trucking Leaders Turn Change Into an Advantage
As the pace of change accelerates in trucking, the fleets that adapt best have more than the latest technology. They have cultures that embrace improvement.
Read More →
Freight Broker Bonds Just Got Harder to Get. Here's What That Means for Your Fleet.
When it gets harder for a freight broker to prove they are financially sound, the ones who cannot clear that bar get pushed out of the market. And those are exactly the brokers who used to leave motor carriers holding the bag.
Read More →
Long-Awaited Canadian Border Bridge to Open in Detroit
For trucking, the bridge opening should offer immediate improvements in efficiency and reliability, with new customs facilities, expanded inspection capacity, and direct freeway-to-freeway connections.
Read More →
Aurora Rolls Out Next Generation of Driverless Trucks for Commercial Freight
Aurora's latest autonomous trucks it's rolling out with International feature lower-cost hardware designed for a million miles as the company expands commercial driverless freight operations across the U.S. Sun Belt.
Read More →
Freight Tonnage Down, Rates up, as Lower Capacity Powers Trucking Recovery
The recovery from the freight recession continues to be driven by reduction in capacity rather than by increased demand.
Read More →
Think Your Trucking Fleet Isn't Using Much AI? Think Again
Shadow AI — the use of unauthorized artificial intelligence tools at work — is becoming increasingly common, putting sensitive company data at risk. Learn how trucking fleets can protect sensitive data while embracing AI.
Read More →
ArcBest Consolidates Brands, Cuts Workforce
The company will bring three business units under the ArcBest brand, eliminate about 2% of positions, and expects the changes to generate $40 million in annual savings.
Read More →
Trucking Fleets Faced Record Operating Costs During Third Year of Freight Recession
ATRI's annual operational cost report shows carriers trimmed fleets, delayed equipment purchases, and ran older trucks as expenses continued to outpace freight rates.
Read More →
Michelin Adds AI Assistant to MyConnectedFleet Platform
Michelin’s new generative AI tool delivers instant fleet insights, helping managers analyze fuel use, tire maintenance, vehicle status, and operational performance without manually creating reports.
Read More →
LytxOne Platform Now Features AI, Compliance, and Asset Tracking Tools
New enhancements add AI-powered insights, asset tracking, compliance automation, and configurable privacy controls to Lytx's all-in-one fleet management platform.
Read More →