


Fact Book 2023: HDT's annual snapshot of where the industry is, where it's been, and long-term trends.
HDT Fact Book 2023: Industry Adjusts to the Downside of the Freight Cycle
While 2022 was a challenging year for trucking, there was still growth in revenue, tonnage, employment, and other areas. In mid-2023, a number of data points appear to indicate that the current freight cycle is bottoming out. How fast it will head back up is another question.
October 26, 2023
Explore the latest industry trends in the Industry section of the 2023 Fact Book.
Source: Canva/HDT Illustration
7 min to read
Trucks moved more than 11.4 billion tons of freight in 2022, generating more than $940 billion — both increases from the previous year, according to the latest edition of American Trucking Associations’ American Trucking Trends 2023.
That's just one of the important trendlines detailed in the HDT Fact Book 2023, HDT's annual snapshot of where the trucking industry is, where it's been and what its current long-term trends are. Among the ATA findings detailed in this year's Fact Book:
- Trucks moved 11.46 billion tons of freight — up from 10.93 billion the previous year.
- The industry collected 80.7% of the nation’s freight bill, generating $940.8 billion.
- Trucking remains a small-business industry: 95.8% of fleets operate 10 or fewer trucks, and 99.7% operate 100 or fewer.
“While 2022 was a challenging year for trucking in many respects, the industry still posted growth in revenue, tonnage, employment, and several other measures,” said ATA Chief Economist Bob Costello.
In mid-2023, a number of data points appear to indicate that the current freight cycle is bottoming out. How fast it will head back up is another question.
Costello cautioned that the association’s For-Hire Truck Tonnage Index “remains in recession territory,” even though the advanced seasonally adjusted tonnage index rose 2.1% in June after increasing 1.2% in May. The index continues to fall from a year earlier, he pointed out, and the May number was off 1.9% from its recent peak in September 2022.
“A multitude of factors have caused a recession in freight, including stagnant consumer spending on goods, lower home construction, falling factory output, and shippers consolidating freight into fewer shipments compared with the frenzy during the goods buying spree at the height of the pandemic,” Costello said. “However, the magnitude of the year-over-year declines is improving, perhaps pointing to a bottom in the freight market.”
ACT Research: Soft Demand
The ACT Research For-Hire Trucking Index showed volumes increased in May. Destocking slowed, pricing rose but continues to contract, and capacity ticked down but is still growing.

While demand remains soft, less destocking may be starting to add to freight available to haul. Inflation shows tentative signs of easing, mainly on lower energy prices, but the current drought in the Great Plains could send food prices higher.
Rates are unlikely to drop further, as marginal capacity continues to fall off amid brutal conditions. Fleets are freezing hiring and selling equipment to manage capacity in this soft freight environment, and coupled with recently improved volumes, rates are likely near bottom.
To repeat ACT’s freight mantra: The cure for low prices, is low prices.

FTR: Weak Trucking Conditions Outlook
Although larger carriers have fared relatively better, overall market conditions for the trucking industry as measured by FTR’s Trucking Conditions Index have been negative since the historic surge in diesel prices in March 2022 following Russia’s invasion of Ukraine.
Core freight-related factors — volume, utilization, and rates — have all weakened sharply relative compared to 2021, when market conditions were strongly favorable for carriers.

FTR does not expect a rapid improvement. The TCI forecast is consistently negative through the middle of 2024. In general, weak rates and elevated financing costs are expected to offset small improvements in freight demand and utilization.
Capacity in the truck freight market is about as loose now as it was at the bottom of the market in 2019. After the extraordinary stress experienced in late 2020 through early 2022, the utilization of active trucks fell sharply before leveling off roughly 4 percentage points below the 10-year average of 92%.

FTR expects active utilization to begin to recover by the middle of 2024 and to recover to the 10-year average by early 2025. But capacity will need to be tighter than that average to significantly push up freight rates.
Data filed with the Federal Motor Carrier Safety Administration indicates that capacity in the for-hire sector of the industry peaked during the summer or fall of 2022, but trucking companies still have added greatly to capacity since the beginning of the pandemic.
According to FTR’s analysis of data in FMCSA’s Motor Carrier Management Information System, driver and truck capacity for for-hire carriers excluding parcel operations have fallen slightly over the past year, while the number of for-hire carriers has fallen more sharply than has capacity.
The key dynamic is that downward changes over the past year have been centered among very small carriers. Carriers with more than 100 trucks have more trucks and drivers today than they did a year ago. This data squares with payroll employment data indicating that employment in trucking remains at nearly an all-time high.
— Contributed by Avery Vise, FTR
Truckstop: 'Drama is Over' in Spot Market
From 2020 through 2022, trucking was regularly in the news. And for the first time in modern memory, “supply chains” were important topics in corporate boardrooms. Such dramatic developments were particularly visible in spot markets, as shown by Truckstop's weekly statistics.
Major departures from normal levels, represented by the dotted line “recovery average,” are apparent. Both the market demand index (MDI) and the price index (spot rates) showed dramatic gains in 2020 and then dramatic falls in 2022.
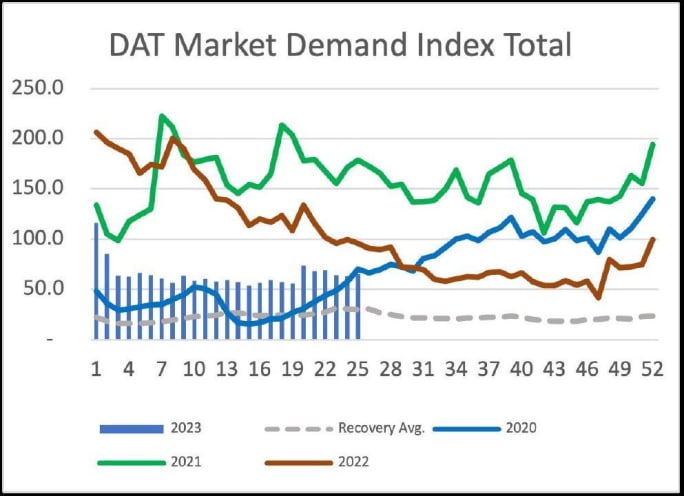
In 2023, Truckstop’s MDI is modestly above the recovery average, while rates are modestly below that average.
Source: Truckstop
In 2023, both indices are back in normal territory. MDI is modestly above the recovery average and rates are modestly below the recovery average. The drama is over.
The same dynamics are occurring in contract markets, albeit with reduced volatility and slower reactions. Expect those markets to be back to normal by fall.
Any changes from this relatively static state await developments in the economy much more than those in supply chain economics. So far in this cycle, the economy has also been in a calm state, growing around 2%. However, enough economists are worried about a possible recession to recommend being prudent in cash management and to have a recession “what if” plan prepared.

It’s like enduring an unusually cold winter. You are never sure when a blizzard will strike, but you have the snowblower tuned and gassed up. After three years of looking within the trucking industry for clues, 2023 is a year to look outside at the economy.
— Contributed by Truckstop
DAT: Where Are We in the Freight Cycle?
The spread between truckload spot and contract rates is an indicator of where we’re at in the freight cycle — the balance of bargaining power among shippers, brokers, and carriers. Spot and contract pricing needs to converge before the next cycle can start.
The last time this happened was in February and March 2022, when freight volumes were at pandemic-induced peaks, and shippers were paying higher contract rates to secure capacity and bring their supply chains back into balance.
Historically, most pricing cycles last around 18 months. Where are we now?
In June, the year-over-year percentage change in dry van spot and contract rates met for the first time since March 2022. By late June and early July, rates on new van and refrigerated freight contracts had started to tumble.

There’s always the prospect that some outside event will kick-start demand for trucks on the spot market — a major strike, for example, or an active storm season. That’s when shippers’ networks become imbalanced, and they turn to brokers and small truckers with the expertise and network to keep supply chains moving. The ripple effect can last well beyond when the event occurred.
With freight contracts expiring, volumes declining, carriers exiting the market, and spot rates moving along without any dramatic changes, shippers entered the second half of 2023 in a strong negotiating position compared to brokers and carriers. However, it may not last much longer. As the gap between spot and contract pricing narrows, truckers will have more flexibility in the freight they accept, and the cycle will continue.
— Contributed by DAT
ATRI: Operational Costs Hit New High

The average total marginal costs in trucking climbed to a new high in 2022 for the second year in a row, increasing by 21.3% over 2021 to $2.25 per mile.

That’s according to the American Transportation Research Institute in its 2023 update to An Analysis of the Operational Costs of Trucking.
Though fuel was the largest driver of this spike (53.7% higher than in 2021), multiple other line-items also rose by double digits.
Driver wages increased by 15%, to 72 cents per mile, reflecting the ongoing industry effort to attract and retain drivers. Driver benefits, however, remained stable.
Atypical market conditions posed unique challenges for acquiring and maintaining equipment in 2022. Truck and trailer payments increased by nearly 19% to 33 cents per mile, as carriers paid higher prices, largely due to equipment impediments in the supply chains.
Closely related, parts shortages and rising technician labor rates pushed repair and maintenance costs up 12% to nearly 20 cents per mile.
Truckload carriers had the lowest average total marginal cost, while specialized carriers had the highest. However, truckload carriers experienced the highest rate of increases in 2022 at 23.6%.
Subscribe to Our Newsletter
More Fleet Management
Aurora Rolls Out Next Generation of Driverless Trucks for Commercial Freight
Aurora's latest autonomous trucks it's rolling out with International feature lower-cost hardware designed for a million miles as the company expands commercial driverless freight operations across the U.S. Sun Belt.
Read More →
Freight Tonnage Down, Rates up, as Lower Capacity Powers Trucking Recovery
The recovery from the freight recession continues to be driven by reduction in capacity rather than by increased demand.
Read More →
Think Your Trucking Fleet Isn't Using Much AI? Think Again
Shadow AI — the use of unauthorized artificial intelligence tools at work — is becoming increasingly common, putting sensitive company data at risk. Learn how trucking fleets can protect sensitive data while embracing AI.
Read More →
ArcBest Consolidates Brands, Cuts Workforce
The company will bring three business units under the ArcBest brand, eliminate about 2% of positions, and expects the changes to generate $40 million in annual savings.
Read More →
Trucking Fleets Faced Record Operating Costs During Third Year of Freight Recession
ATRI's annual operational cost report shows carriers trimmed fleets, delayed equipment purchases, and ran older trucks as expenses continued to outpace freight rates.
Read More →
Michelin Adds AI Assistant to MyConnectedFleet Platform
Michelin’s new generative AI tool delivers instant fleet insights, helping managers analyze fuel use, tire maintenance, vehicle status, and operational performance without manually creating reports.
Read More →
LytxOne Platform Now Features AI, Compliance, and Asset Tracking Tools
New enhancements add AI-powered insights, asset tracking, compliance automation, and configurable privacy controls to Lytx's all-in-one fleet management platform.
Read More →
July Imports Poised to Set Container Record
The National Retail Federation projects July container imports will surpass the pandemic-era record as shippers frontload freight ahead of expected August tariff increases.
Read More →
HDT Announces 2026 Truck Fleet Innovator Finalists
From AI and fleet electrification to safety, operations, and leadership, these HDT Truck Fleet Innovator finalists are changing how trucking gets done.
Read More →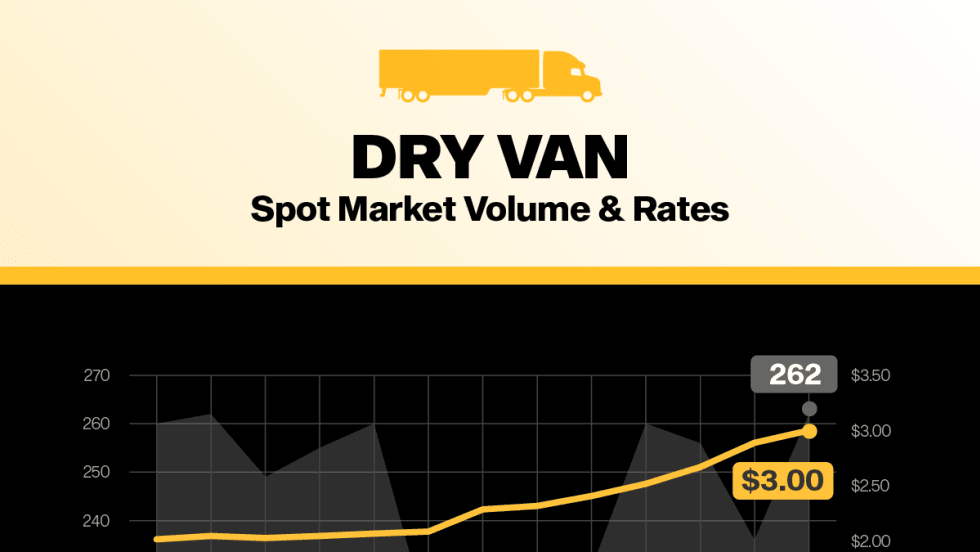
Van Spot Rates Top Contract Rates for First Time Since 2022
There’s more good economic news for the North American trucking industry according to the latest Truckload Volume Index report from DAT.
Read More →