


FTR has released the COVID-19 Impact Heatmap, which assesses the state-level rate impacts by four trucking equipment types – dry van, refrigerated, flatbed, and specialized – using Truckstop.com spot market data.
Interactive FTR Heatmap Shows COVID-19 Impacts on Truck Rates by State
FTR has released the COVID-19 Impact Heatmap, which assesses the state-level rate impacts by four trucking equipment types – dry van, refrigerated, flatbed, and specialized – using Truckstop.com spot market data.
April 2, 2020
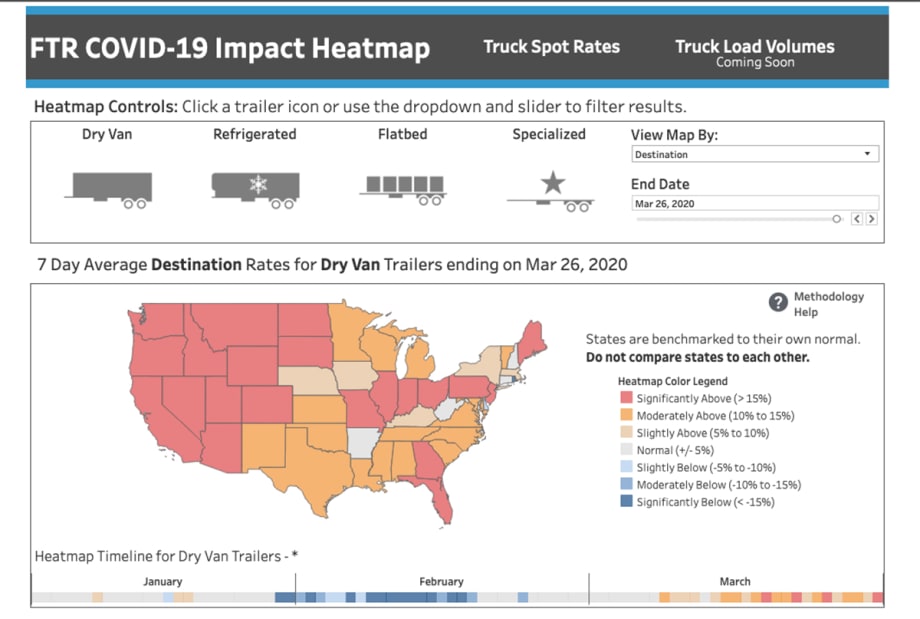
Image: FTR
2 min to read
Each combination of states and equipment type reflects rate trends for the states both as origins and destinations using the most recent seven days from the date selected. This publicly available map can be viewed now on the FTR website.
“Truck drivers and the companies that employ them are on the front lines of America’s response to the coronavirus crisis,” said Avery Vise, FTR vice president of trucking. “Trying to keep up with the myriad state and local restrictions and fluctuating conditions can be overwhelming, but as markets often do, truck spot rates naturally reflect these stresses. By showing how rates in individual states deviate from what FTR assesses to be the norm absent the COVID-19 crisis, we believe we are providing a valuable analytical tool to shippers, brokers, and carriers and even to those who simply want to understand how the crisis is affecting U.S. commerce.”
FTR’s analysis examines historical seasonal behavior regarding rates in each state and normalizes the data to represent how the trucking environment would look in a typical growth economy. By comparing that norm to the current rate environment, the industry can understand how COVID-19 is affecting rates on a state-by-state basis.
The data used to create the heatmaps compare the most recent seven days to the same seven days over the last five years. This data is then compared to the last month – January – during which COVID-19 had no significant impact on U.S. transportation. Because of inherent data variations, “normal” is defined as a range rather than a specific number. The maps’ color variations indicate the degree to which rates deviate – higher or lower – from that normal range over the most recent seven days. A slider function allows the user to change the snapshot for any date to provide a seven-day lookback for any date going back to early January. This feature provides insights into how the COVID-19 impacts have changed over time.
It is important to understand that the heatmaps reflect the status of a given state’s rates compared to its own normal range. It does not indicate anything about the relative level of actual spot rate levels among states.
Following this release, FTR is scheduled to develop additional dashboards to provide greater visibility into how COVID-19 is affecting transportation. The next feature to be added to this map will show truck load volumes.
More Fleet Management

'Beyond Compliance,' Regulations, Driver Coaching on ATRI’s 2026 Research List
The American Transportation Research Institute will examine driver coaching, regulatory impacts — including the "Beyond Compliance" concept —and weather disruptions that shape trucking operations.
Read More →
Fleet Advantage's Brian Antonellis on the Growing Need to Replace Old Trucks
Fleet Advantage's Brian Antonellis says it's time for fleets to get back to the fundamentals of good maintenance practices. And that includes replacing older, inefficient equipment.
Read More →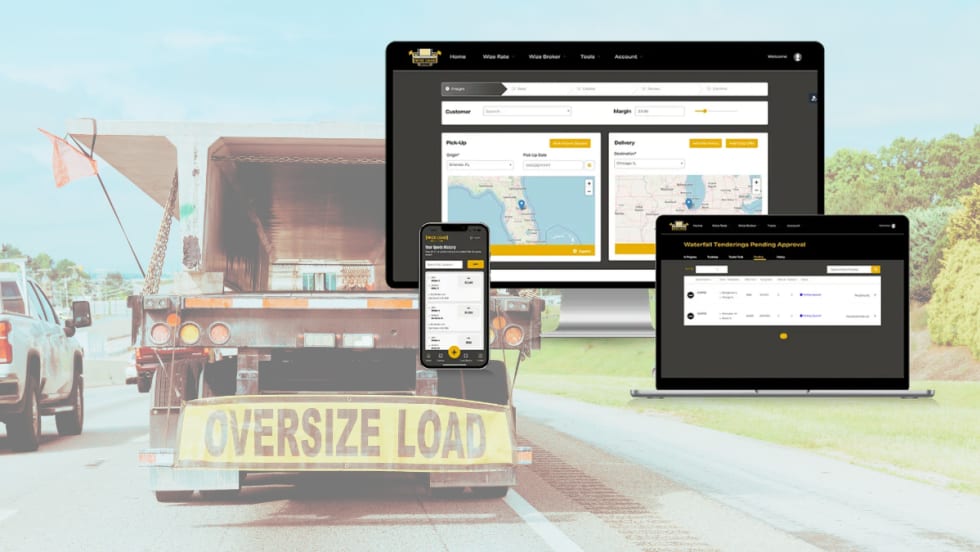
Truckstop.com Adding to Open Deck, Heavy Haul Offerings
Load matching for flatbed, lowbed, oversize and overweight loads can't be automated like basic van freight, but Truckstop.com is adding more high-tech tools to help.
Read More →
Trucker Path, Truckstop.com Expand Load Access Partnership
An expanded Trucker Path and Truckstop.com integration brings more freight opportunities into the TruckLoads app while emphasizing security and network quality.
Read More →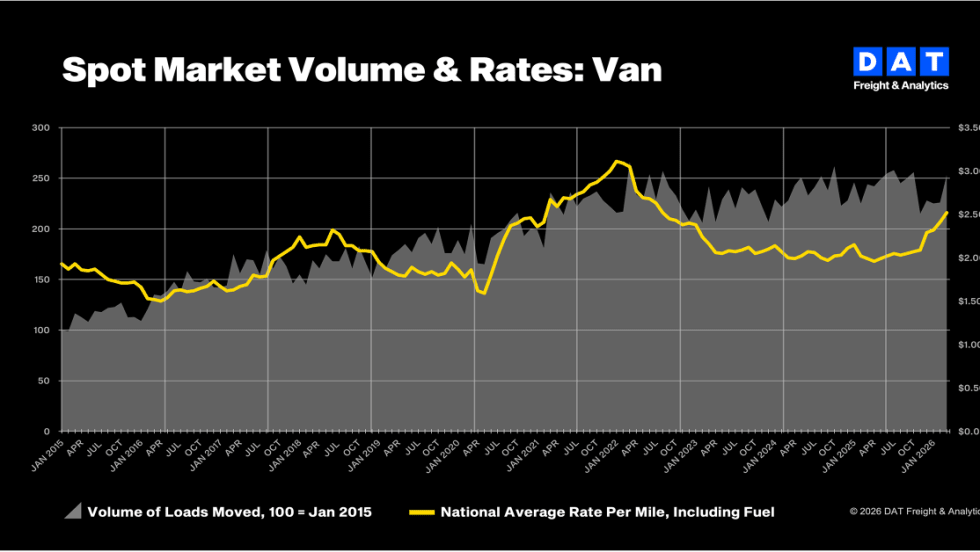
Truckload Rates Hit Two-Year Highs as Diesel Costs Surge, DAT Says
Strong March freight demand combined with a spike in fuel costs pushed both spot and contract truckload rates to their highest levels in more than two years.
Read More →
The AI Conversation You Need to Have with Your TMS Provider
Everyone’s talking about AI — but is your transportation management system actually built for it?
Read More →
Kriska Buys Fellow Canadian Carrier Sharp Transportation Systems
Being part of KTG will allow Sharp to expand and improve its services.
Read More →
Bill in House Would Raise Minimum Insurance for Motor Carriers to $5 Million
The Fair Compensation for Truck Crash Victims Act would increase insurance requirements for interstate motor carriers by nearly seven times.
Read More →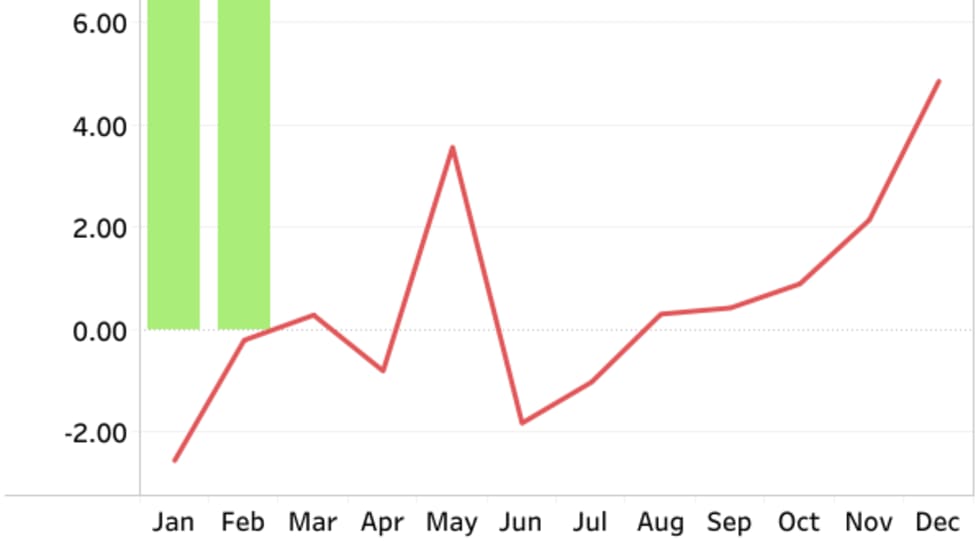
FTR Trucking Conditions Index Hits Four-Year High in February
Strong freight rates push TCI to 10.2, but FTR expects fuel-price volatility to skew March results.
Read More →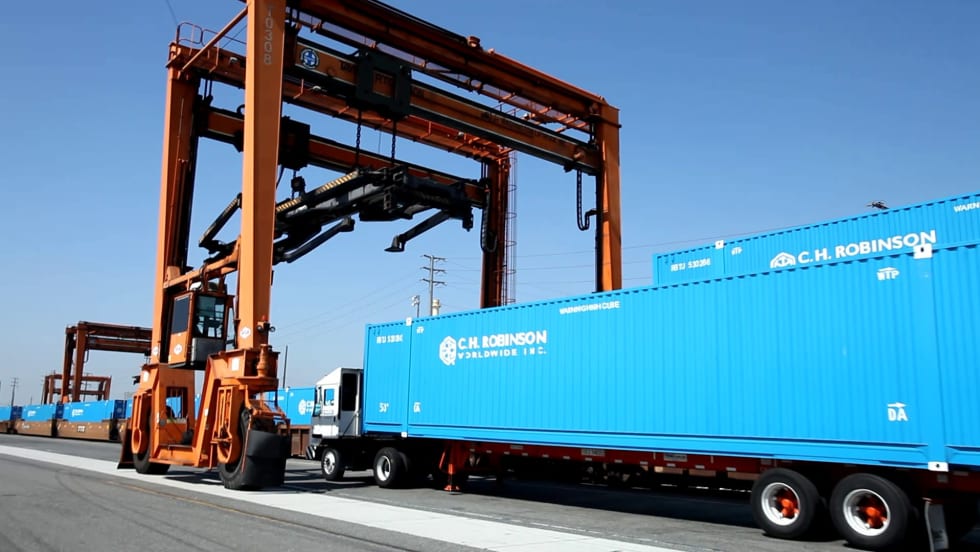
C.H. Robinson Offers Carriers Relief as Diesel Prices Surge
C.H. Robinson is waiving fees on fuel cards and cash advances for April and May, aiming to help carriers offset rising diesel costs tied to geopolitical instability.
Read More →