


Related: How a Tough Winter Impacted Trucking
When Economic Data Isn’t What It Appears to Be
The first few months of 2019 showed many inconsistencies in economic data, varying wildly from month to month. Is our economy really this inconsistent or is there another reason for the variation?
May 2, 2019

The first few months of 2019 showed many inconsistencies in economic data, varying wildly from month to month. Is our economy really this inconsistent or is there another reason for the variation?
Image by Mediamodifier from Pixabay
3 min to read
I’ve been talking with various economists about the inconsistency of the economic data we have been seeing since December regarding job creation and consumer spending. Retail sales were unexpectedly down 1.2% in December, but in January beat expectations by 1.3%. Then they were unexpectedly down 0.2% in February. Similarly, job growth of 20,000 was a large disappointment in February, but in March, U.S. job creation jumped to a better-than-expected 200,000.
Is our economy really this inconsistent? Was the accuracy of the economic data impacted by the government shutdown? By the Polar Vortex? Possibly, but I believe the real culprit is a practice that compromises most economic data – seasonal adjustments.
I like to use non-seasonally-adjusted data, which is the actual data. I believe it shows what really happens, and is a more meaningful way to measure year-to-year changes in activity. However, most economic data reported on the news is seasonally adjusted. In other words, the data you see reported is not the actual number – it’s an adjusted figure, changed by someone’s estimate of a 10-year seasonal trend.
I can explain the difference in the example below. (My friend Steve is an economist.)
Me: “Hey, Steve, nice June weather we have had. Only 10 days of rain.”
Steve: “Yes, Jeff, that is quite the break from May – five fewer days of rain.”
Me: “That was twice as much rain as last year, but June 2017 was an unusually dry June.”
Steve: “Well, actually, when we report this number to the media, it’s going to be only one fewer day of rain, as seasonally, June has a 70% adjustment factor.”
Me: “Isn’t that telling a different story than the five fewer days of rain we had?”
Steve: “Yes, but seasonally, June had only one fewer rain day.”
As you can see, the seasonal adjustment paints a different picture than the reality of the data. While this seems simple, let’s raise the complexity level and look at retail sales or auto sales.
The rapid growth of Amazon Prime, e-commerce, and the move toward home delivery has led to significant changes in consumer buying habits, as well as the employment of labor across many other industries related to the change in the holiday season and winter shopping in general. September/October has picked up in activity, and November/December now sees less of a late holiday surge, with more gifts exchanging in the January/February time frame because of gift cards and the like. However, seasonally, the adjustment factors typically used are 10-year averages, which do not reflect the realities of the past few years as accurately, because the trends have changed.
As such, how surprised should we be that retailers reported weaker-than-expected sales in December (formerly the big shopping rush), and stronger-than-expected results in January? What about the lack of job growth in the February data? An anomaly, perhaps, created by seasonally adjusted reported data, only to be shown materially stronger than expected in the month of March. The trick is, many of us listening to the headline reports on the news do not realize that the actual data has been adjusted by a seasonal factor.
The same applies to auto and truck order data. These figures may be shown both ways in the data, but the headline data is altered by someone’s estimate of a seasonal adjustment. With truck OEMs this year largely sold out through 2019, should we be surprised that the data is weaker than the normal seasonal trend?
Subscribe to Our Newsletter
More Fleet Management

How Innovative Trucking Leaders Turn Change Into an Advantage
As the pace of change accelerates in trucking, the fleets that adapt best have more than the latest technology. They have cultures that embrace improvement.
Read More →
Freight Broker Bonds Just Got Harder to Get. Here's What That Means for Your Fleet.
When it gets harder for a freight broker to prove they are financially sound, the ones who cannot clear that bar get pushed out of the market. And those are exactly the brokers who used to leave motor carriers holding the bag.
Read More →
Long-Awaited Canadian Border Bridge to Open in Detroit
For trucking, the bridge opening should offer immediate improvements in efficiency and reliability, with new customs facilities, expanded inspection capacity, and direct freeway-to-freeway connections.
Read More →
Aurora Rolls Out Next Generation of Driverless Trucks for Commercial Freight
Aurora's latest autonomous trucks it's rolling out with International feature lower-cost hardware designed for a million miles as the company expands commercial driverless freight operations across the U.S. Sun Belt.
Read More →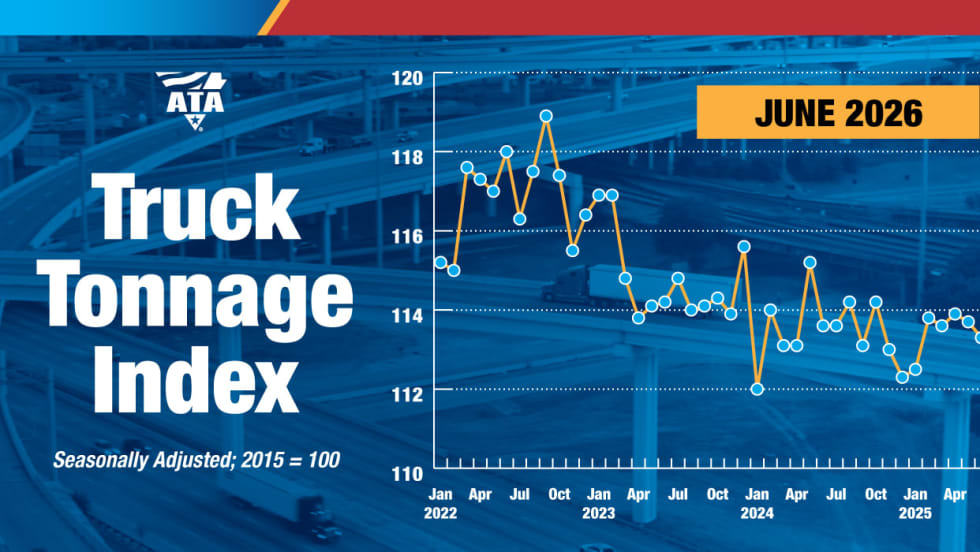
Freight Tonnage Down, Rates up, as Lower Capacity Powers Trucking Recovery
The recovery from the freight recession continues to be driven by reduction in capacity rather than by increased demand.
Read More →
Think Your Trucking Fleet Isn't Using Much AI? Think Again
Shadow AI — the use of unauthorized artificial intelligence tools at work — is becoming increasingly common, putting sensitive company data at risk. Learn how trucking fleets can protect sensitive data while embracing AI.
Read More →
ArcBest Consolidates Brands, Cuts Workforce
The company will bring three business units under the ArcBest brand, eliminate about 2% of positions, and expects the changes to generate $40 million in annual savings.
Read More →
Trucking Fleets Faced Record Operating Costs During Third Year of Freight Recession
ATRI's annual operational cost report shows carriers trimmed fleets, delayed equipment purchases, and ran older trucks as expenses continued to outpace freight rates.
Read More →
Michelin Adds AI Assistant to MyConnectedFleet Platform
Michelin’s new generative AI tool delivers instant fleet insights, helping managers analyze fuel use, tire maintenance, vehicle status, and operational performance without manually creating reports.
Read More →
LytxOne Platform Now Features AI, Compliance, and Asset Tracking Tools
New enhancements add AI-powered insights, asset tracking, compliance automation, and configurable privacy controls to Lytx's all-in-one fleet management platform.
Read More →