

Related: Economic Growth Ahead at Trend Level
Commentary: Freight Market Tightness Points to 3 Possible Economic Outcomes
The freight market is still tight in 2019, despite changing conditions over the course of 2018 that originally drove it forward. Noël Perry, chief economist at Truckstop.com, thinks that the current data points to three possible outcomes.
by Noël Perry, Chief Economist, Truckstop.com
February 28, 2019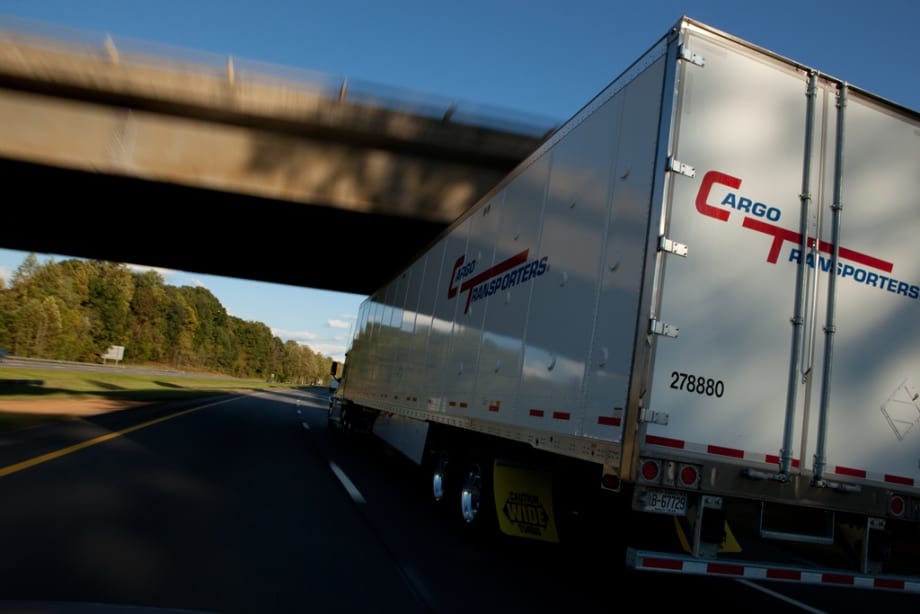
The regulatory changes that were such an important part of industry dynamics in early 2018 are over, so conditions have improved, according to Noël Perry.
Photo: Cargo Transporters
5 min to read
Some things are easy to see. Let’s start with the most obvious conclusion about what I call “market tightness,” as derived from Truckstop.com’s Market Demand Index (see chart). This tracks the ratio of loads posted to trucks posted. The higher the number, the tighter the market. It is called an “index” because it does not represent a literal description of market tightness
That the chart’s dark blue line was falling for almost all of 2018 tells us that the spot market is not as tight as it was last January or June. But the bars representing 2019 data are still 100% above the recovery average. The market is still tight, just not as tight as it was.
This data matches what else we know about the current market: The regulatory changes that were such an important part of industry dynamics in early 2018 are over, so conditions have improved. Still, freight growth remained strong throughout 2018; hence; the market is still tight.
Beginning in Week 41 of the data, the decline stopped and the data moved up. Moreover, the increase persisted for 10 weeks-- more than enough to take seriously. Remember Perry’s Law: If the data are consistent for three or more observations, take it seriously. So, we are presented with three possibilities… and economists love possibilities.
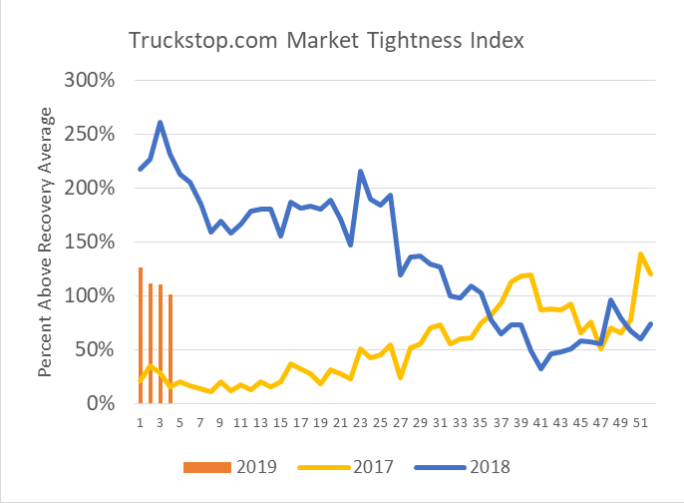
Data indicates that the spot market is not as tight as it was last year. But the bars representing 2019 data are still 100% above the recovery average.
Source: Truckstop.com
Possibility No. 1: Trend reversal
The first possibility is the chance that the trend has reversed permanently. Maybe President Trump’s regulators are actually improving productivity for trucking, or the economy has accelerated. The American Trucking Associations’ tonnage index was very strong in November. But I don’t buy this possibility, because the numbers started down again in January and the ATA tonnage index was weak in December.
Possibility No. 2: A new normal
The second possibility is the chance that we have reached a floor permanently above the previous norm. In other words, we have reached a “new normal.” The argument here is that the fleets have reached their limit in recruiting and will have to wait until an economic slowdown before finally eliminating the big deficit that appeared in late 2017 and early 2018. This view is possible, but we won’t know for at least three or four months.
Possibility No. 3: It’s just a pause
My vote goes for possibility number three – that we had a temporary slowing in the trend. Look at the 2018 data in Week 8 through Week 24. The downward trend paused there, too, before resuming for another 18 weeks. That is the nature of such data; it moves in spurts, not in steady trends. This view is important because, if right, it means industry conditions will continue to moderate in 2019.
What about pricing?
Such a discussion of economic uncertainty has benefit because the three different possibilities have decidedly different implications for service and pricing. Truckstop.com collects reliable, real-time spot market pricing data (displayed here with the same reference to the recovery average as above). You can immediately see that the pricing data is moving just like the tightness data.
When the market is tight, people pay more and vice versa. Economists call that a positive correlation: One data set moves with another. We conclude that prices have fallen, just as they should; they are still above normal, just as they should be; they stopped their down move in December, just as they should; they have started going down again, just as they should.
Also of note is that events on the pricing chart occur about a month after they occur on the tightness chart. Economists call that a “lag.” It takes time for people to react to changes in the market. In this case, it’s taken a month. Contract prices lag by four to six months.
Oops! A Christmas surprise
Finally, there is the curious issue of the spike at the end of the year. In 2017, we attributed that spike to the start of the electronic logging device mandate, but it happened again in 2018. Maybe we are seeing the start of a new seasonal effect having to do with post-Christmas online ordering.
That hypothesis is interesting because by benchmarking this data to the recovery average, I attempted to eliminate seasonality. If the 2010-2017 recovery average had this spike, no spike would show here. So, it is possible that we have a spanking new seasonal effect, thanks to Jeff Bezos and Amazon. Either way, the data demonstrates the importance of dealing with seasonality. For instance, the fall in the 2019 bars in this chart are “seasonally corrected.” The nominal data is falling even faster.
So, what?
As with the tightness of data, we have three possibilities in 2019: Trend reversal, new normal for the average (prices will hit a floor above the old normal), or a pause before falling more. I predict a combination of options two and three.
I believe the industry has experienced a permanent increase in cost due to productivity loss and driver pay increases that will halt the current decline above the old normal. I think there’s a way to go before we hit that new normal.
People are talking increasingly about recession. If we begin to head that way, even if the actual recession isn’t until 2020, spot prices will fall much more; they always do. For the time being, no recession is in sight.
There is reason to hope for acceptable spot market pricing through most of 2019, probably lower than now, and certainly much lower than last year. If you want more than that from this economist, dream on.
Noël Perry is chief economist at Truckstop.com and owner of Transport Futures. An economist specializing in freight and transportation topics, he follows developments in such areas as market sizing, operations, technology, modal competition, pricing, regulation, and public policy.
Subscribe to Our Newsletter
More Fleet Management
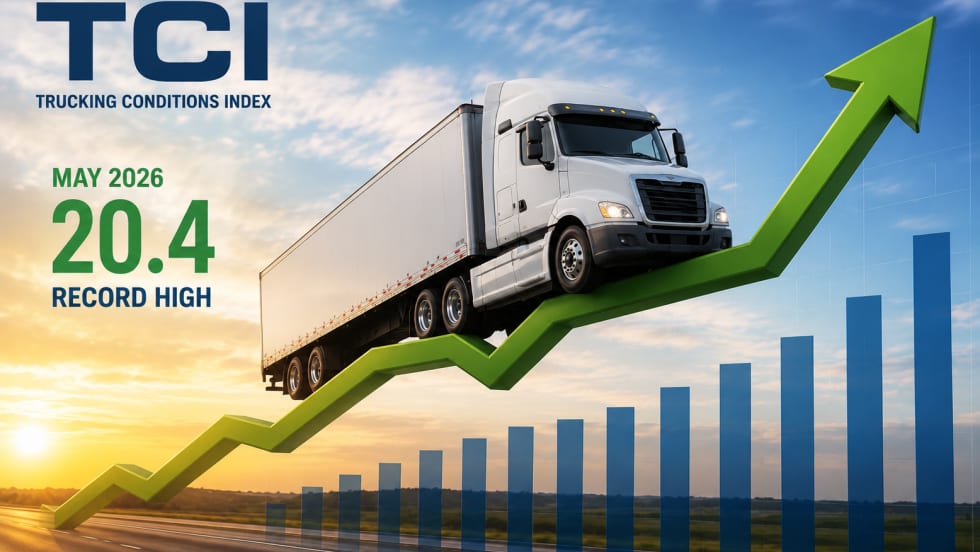
FTR Says Freight Rates Surged in May
FTR's Trucking Conditions Index surged to a record high in May, the analytics firm reports.
Read More →
Meet HDT's Truck Fleet Innovators at Heavy Duty Trucking Exchange
Heavy Duty Trucking Exchange brings fleet managers and suppliers together for the deeper conversations that lead to ideas, partnerships, and solutions. Time is running out to apply for HDTX, September 23-25.
Read More →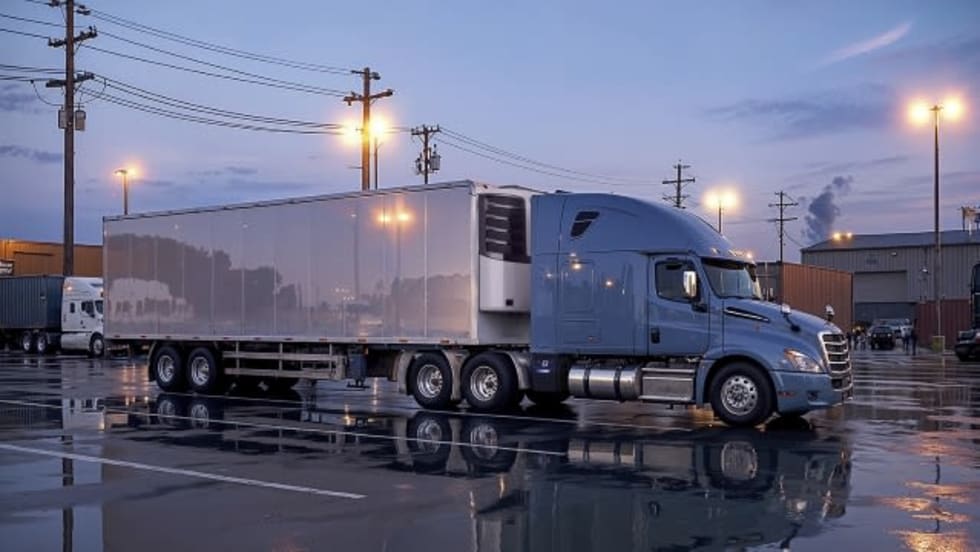
Sponsored•July 1, 2026
Enhance Fleet Performance with High-Efficiency Auxiliary Power Units
Drive sustainable cost savings while increasing driver comfort during short- and long-haul logistics operations.
Read More →
Sponsored•June 30, 2026
Is Your Parts Procurement Process Reactive or Proactive?
Ready to revamp your parts procurement process? Learn how now with “Strategic Parts Purchasing: A Process Checklist”
Read More →
What Trucking Events are Happening in 2026?
Looking for trucking-related conventions, expos, and other events? Heavy Duty Trucking has developed this list of national and larger regional trucking shows and events.
Read More →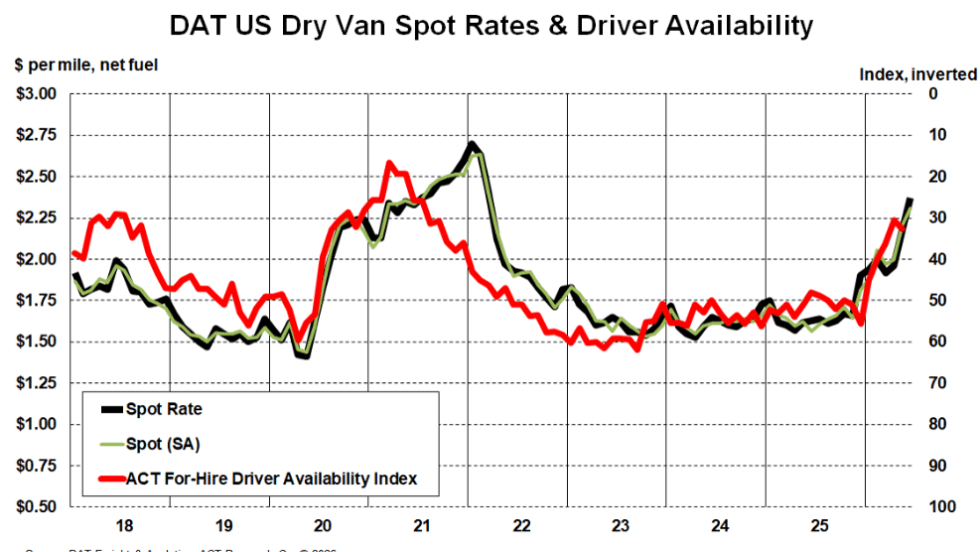
Truckload Rates Keep Rising as Tight Capacity Fuels Freight Market Recovery
Spot and contract rates continued climbing in May and June, not because freight demand is surging, but because fewer trucks and drivers are available.
Read More →
What Geotab's New AI Connector Means for Fleets
Fleets can now ask their usual AI assistants questions about maintenance, safety, fuel use, and vehicle performance, using their live Geotab data, and take action on the answers without leaving their preferred AI tool.
Read More →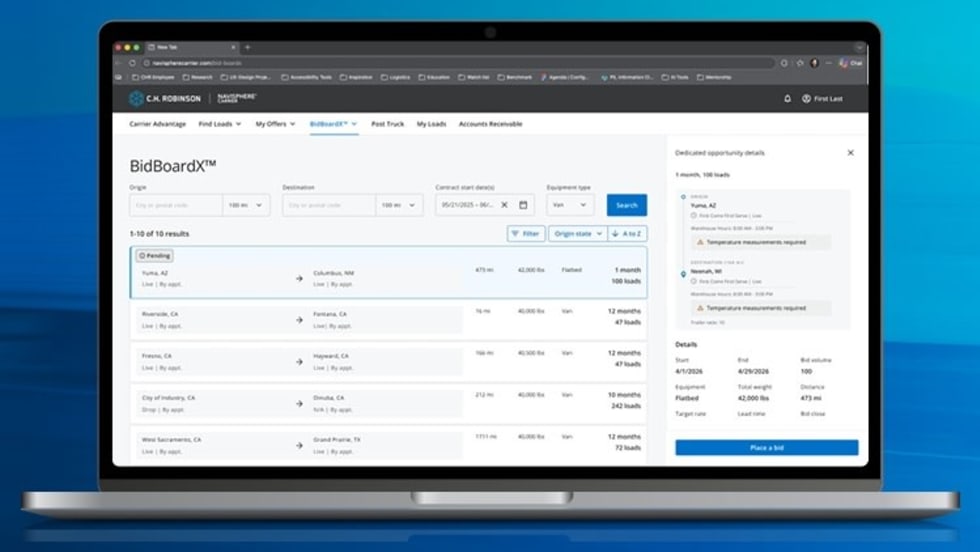
New C.H. Robinson Tool Opens Door to More Predictable Freight
BidBoardX lets carriers search, bid on, and secure committed freight opportunities through a single digital marketplace.
Read More →
New York City's Microhub Project is Delivering Results
Trucking, last-mile delivery companies, and environmental advocates like what they are seeing so far with New York's microhub program.
Read More →
Why Truck Detention Keeps Costing Fleets Time and Money
A 2024 ATRI study found detention affects nearly 40% of truckload stops and costs the industry more than $15 billion annually. Despite the toll on drivers, fleets, and supply chains, the problem remains stubbornly persistent.
Read More →