





"Chocolate doesn’t fit under the category of 'finished metal shapes.' Nor do pharmaceuticals or watches. So that brings us to gold, specifically pure gold – the kind they keep at Fort Knox."
Record January Imports Didn't Produce Much Freight
FTR's Avery Vise digs into the numbers behind January's import surge in this column.
March 13, 2025

Once again, a surge in imports did not translate into a surge in truck freight.
Image: HDT Graphic
4 min to read
U.S. imports of goods in January surged 12.5% month over month, seasonally adjusted, to an all-time high. But we didn't see that reflected in the freight market.
Although several major categories of imports rose during the month, the standout was industrial supplies, which jumped more than 34% month over month in January after rising 19% in December.
Detailed data showed that a category called “finished metal shapes” was responsible for almost all the strength in industrial supplies imports, jumping 149% in January after soaring 202% in December.
Is January Import Surge Tariff Threats at Work?
“Finished metal shapes” is a rather vague and broad descriptor that sounds like it would be what we think of as fabricated metal products.
The notion that there would be a surge in December or January would not be surprising given an expectation for tariffs, but the scope of that increase seemed inconceivable.
A clue to the source of the surge comes from January’s ranking of exporters to the U.S in terms of dollar value. The top three are always the same: Mexico, China, and Canada.
The fourth largest exporter in January, though, was rather shocking. Switzerland beat out the likes of Germany, Vietnam, Japan, Taiwan, and South Korea, among others. In both 2024 and 2023, Switzerland was only the 15th largest exporter of goods to the U.S. in dollar value.
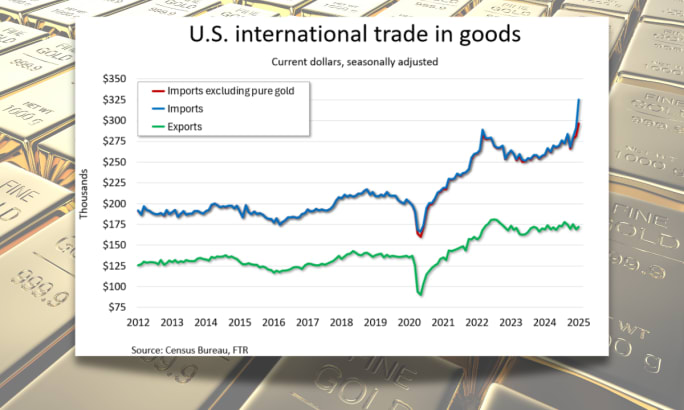
Although several major categories of imports rose during the month, the standout was industrial supplies, which jumped more than 34% month over month in January after rising 19% in December.
Image: HDT Graphic from FTR data
Chocolate doesn’t fit under the category of “finished metal shapes.” Nor do pharmaceuticals or watches. So that brings us to gold, specifically pure gold – the kind they keep at Fort Knox.
The type of gold is notable because another commodity within the broad category of industrial supplies is nonmonetary gold, which also saw a sizeable increase but nothing like finished metal shapes. Nonmonetary gold presumably is for more industrial uses, like gold-plating and filling tooth cavities. Switzerland is the largest supplier of pure gold to the U.S. by far.
Pure gold normally does not account for much of America’s imports in dollar value. For example, the monthly average dollar value was about $1 billion in 2023, and with rising prices, the average during July through November 2024 had risen to about $1.45 billion a month.
Gold imports then jumped to $9.7 billion in December. That sounds like a lot — until you learn that the value of gold imports in January skyrocketed to $28.7 billion, according to Census Bureau data.
Why Was Switzerland Sending So Much Gold to the U.S.?
The factors behind the surge are speculative, but it isn’t a function of price. Gold prices have risen this year, but current prices are only about 10% higher than they were at the beginning of the year.
Two possibly interrelated factors likely were at play.
President Trump campaigned on universal tariffs, and a 10% to 20% tariff on something that costs $2,900 an ounce is big money, even for someone who can afford it in the first place. So, like many goods, importers could have been trying to get ahead of the tariffs.
The second and more troubling possibility stems from the fact that gold is the go-to hedge for people worried about the stability of the U.S. and/or global financial markets. The last sustained run-up in pure gold imports was in the lockdown phase of the pandemic in 2020.
Regardless of the reason, pure gold obviously does not generate any significant freight volume.
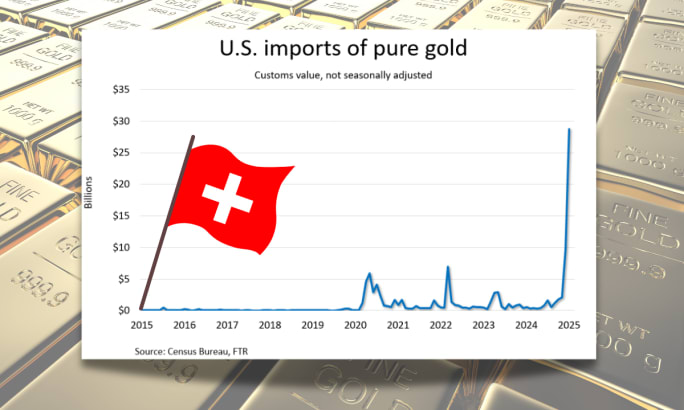
Gold imports jumped to $9.7 billion in December. That sounds like a lot — until you learn that the value of gold imports in January skyrocketed to $28.7 billion.
Image: HDT Graphic from FTR data
How Many Trucks Would You Need to Transport $28.7 Billion in Gold?
How much freight would it be? Clearly, gold bars and ingots would not move by tractor-trailer once they arrived in the U.S., but just for fun let’s assume they did.
In January, the average price of gold was about $2,700 an ounce. Therefore, $28.7 billion in gold equals about 10.6 million ounces, or 664,000 pounds.
Assuming a tractor-trailer payload of 45,000 pounds – and I think we can safely assume the loads would gross out before cubing out – that’s fewer than 15 full truckloads of gold. Imagine the cargo insurance policy premium!
As noted earlier, the surge in gold was not the only strength for imports. January imports were a record even excluding gold from the calculation. However, the principal strengths came in areas that are high in value but low in freight impact – items like computers and pharmaceuticals.
Subscribe to Our Newsletter
More Fleet Management

Sponsored•September 16, 2026
Color Match Smarter: Tools That Restore & Perform
For fleet managers and collision repair professionals keeping heavy-duty trucks on the road, getting the color right the first time isn't just about appearance — it's about efficiency, turnaround time, and bottom-line results. Discover how today's digital color tools are transforming the repair process from guesswork to precision.
Read More →
FMCSA Pauses Biennial-Update Enforcement Amid Motus Transition
Carriers whose updates were due on or after June 1 have more time, while FMCSA works to stabilize its new registration system and warns of phishing sites impersonating its new carrier registration system, Motus.
Read More →
Sponsored•September 14, 2026
2026 Blueprint for Countering Smarter Supply Chain Theft
Cargo theft is no longer just the cost of doing business. It's a multi-billion-dollar criminal enterprise exploiting vulnerabilities across your fleet, drivers, and supply chain.
Read More →


Sponsored•September 1, 2026
How Telematics Improves Visibility, Control, and Performance in Refrigerated Fleets
Explore how telematics help refrigerated fleets improve visibility, uptime, efficiency, compliance, and cargo protection across connected cold chain operations.
Read More →
What the U.S.-Canada Trade War Means for Trucking
Escalating U.S.-Canada tariffs could disrupt cross-border freight, reduce truck volumes, raise costs, and create new uncertainty for carriers on both sides of the border.
Read More →
What Are Trucking’s Top Concerns for 2026?
The American Transportation Research Institute wants to know what's worrying trucking fleet managers, drivers, and other stakeholders in its annual Industry Issues survey.
Read More →
American Trucking Associations Looks for a New Leader
ATA President and CEO Chris Spear abruptly left his job at the association on August 21, at a pivotal time for the trucking industry.
Read More →
Public Wi-Fi Cybersecurity Risks: How Truck Drivers and Fleets Can Protect Their Data
Public Wi-Fi can expose truck drivers and fleets to credential theft, malware, and other cyber threats. Here’s how to reduce the risk on the road.
Read More →
For Nicky Cupp, Fleet Innovation Starts With Frustration
HDT Truck Fleet Innovator Nicky Cupp turns everyday pain points at Fraley & Schilling into opportunities for better technology and smarter processes.
Read More →
Adam Buttgenbach’s Approach to Electric Trucks: Start With Where They Fit
HDT Truck Fleet Innovator Adam Buttgenbach helped PepsiCo build one of North America’s largest EV fleets by focusing on where electric trucks make operational sense.
Read More →