


Fact Book 2023: HDT's annual snapshot of where the industry is, where it's been, and long-term trends.
HDT 2023 Fact Book: Class 8 Truck Orders and Backlogs Among Key Equipment Concerns
Heavy- and medium-duty truck production improved in 2022 and OEMs were building at full capacity in 2023. The exit of some smaller fleets increased the availability of used Class 8 trucks as well during 2023.
October 30, 2023
Delve into medium- and heavy-duty truck trends of 2023 and explore backlogs, trailers, and maintenance costs.
Source: Canva/HDT Illustration
6 min to read
Medium- and heavy-duty commercial vehicle production improved steadily throughout 2022, and OEMs have been building at essentially full capacity in 2023. Sales, order, and backlog trends are covered in the HDT Fact Book 2023, HDT's annual snapshot of where the trucking industry is, where it's been, and what its current long-term trends are.
Some 309,615 Class 8 units were sold in 2022. Seasonally adjusted Class 5-7 2022 retail sales were close to 230,000.
So far this year, demand remains strong as elevated replacement demand persists, but we expect capacity growth to slow on lower capital spending, following lower rates and as fleets pause hiring or decrease headcount.
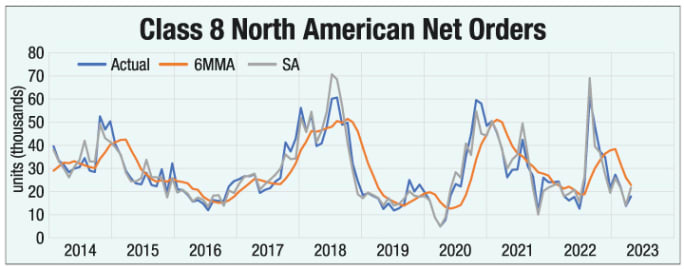
Class 8 orders tracked by ACT Research bounced back a bit in May, following a soft April. May orders were up 30% year over year to 15,623 units, with seasonal adjustment lifting orders to 19,000 units.
(As we went to press, ACT announced June Class 8 orders rose 9% year over year to 16,773. Seasonal adjustment would put that number at 20,300.)
With 142,000 units built year-to-date as of May and 195,000 units in backlog scheduled for 2023, there aren’t many empty build slots available to claim in 2023.
Coupling the annual seasonally weak period of orders (typically April-August) and healthy supply chains enabling elevated production, the Class 8 backlog will be on a downward trajectory until 2024 order boards open, noted ACT.
Meanwhile, market demand in recent months has favored trucks over tractors. Tractor orders were up 7% year over year in May, while truck orders rose a stronger 19% from a year earlier. That trend continued even more strongly in in June, as tractor orders declined 1% year over year while truck orders rose 28%.
Class 5 truck orders were up 61% in May, pushing medium-duty Class 5-7 orders up overall 35% year over year to 20,141 units (21,900 seasonally adjusted). The seasonally adjusted orders were 16% above the 18,000 per month averaged over the preceding 12 months, and 22% above the year-to-date average of 17,900.
June’s Class 8 backlog decline met expectations as seasonally weak orders ran headlong into strong production. For second-half 2023 production, only 11,000 units of June’s backlog is sitting in 2024.
Source: ACT Research

Class 5-7 medium-duty net orders surged 27% year over year in May with 19,000 units (up 3% from April), and retail sales were up 26% from last year at 22,800 units.
Source: ACT Research
The Medium- and Heavy-Duty Truck Market

More than a third of the Class 8 trucks sold in the U.S. last year were Freightliner-badged.
Source: HDT Analysis of Ward's Intelligence Data
According to the American Truck Dealers association, Class 8 truck sales topped 254,000 units in 2022, up nearly 15% from 2021. Sales of medium-duty trucks dropped 6% to 221,834, ATD reports.
In HDT’s analysis of Ward’s Intelligence U.S. commercial vehicle retail sales data, compared to five years ago, Freightliner’s 2022 Class 8 market share is essentially the same as in 2017. International and Volvo each saw market share increase by 2 percentage points.
On medium-duty, if you look only at Class 7, Freightliner has nearly half the market share at 49%, with International in second place with 30%. At the lighter end of the spectrum in Class 5, Ford has the lion’s share of the market at 47%. In Class 6, Freightliner and Ford are neck-and-neck at nearly 30% each, followed by Navistar.
Private Fleets Extend Trade Cycles
Respondents in this year’s National Private Truck Council benchmarking survey report their heavy-duty equipment trade cycles at 6.35 years, nudging slightly ahead of last year’s 6.3 years (tied for the fastest equipment turns in the history of the survey).
As measured by mileage, trade cycles increased to 643,000 miles, which is 43,000 miles more than last year’s replacement cycles of 620,000 miles for the average Class 8 tractor.
These trade cycles include all Class 8 equipment, both owned and leased, the latter of which typically has peppier trade cycles. When those fleets that lease the majority of their equipment are removed, the trade cycles lengthened slightly‚ by nearly two years in the case of those fleets that owned the majority of their equipment and by one year for those fleets that acquired equipment using a combination buying/leasing approach.
For companies that lease 90% or more of their Class 8 equipment, the trade cycles are reported at 5.3 years and 512,800 miles. Last year, those trade cycles averaged 5.5 years and 512,000 miles, and the year previously, the trade cycles for this group were 6 years and 574,000 miles.
For those fleets that own 90% or more of their Class 8 equipment, the trade cycles are 7.2 years and 735,800 miles. Both of these reflect increases over last year’s results. Last year, the trade cycles for this group were reported to be 6.9 years and 662,440 miles; the year before was 6.6 years and 656,000 miles.
This is clear evidence of the fleet strategy to extend trade cycles, particularly when they are in an ownership position.
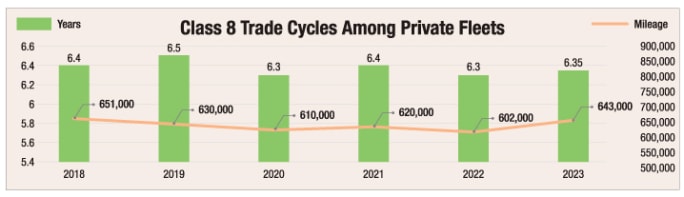
The National Private Truck Council's benchmarking survey shows a private fleet strategy to extend trade cycles, particularly when they are in an ownership position.
Source: National Private Truck Council
Fleets Get More Options in Used-Truck Market
Used Class 8 values peaked in the first half of 2022, breaking the $100,000 ceiling for the first time, according to American Truck Dealers, but have declined since.
According to ACT Research, used Class 8 retail volumes (same-dealer sales) improved by 12% in May from the previous month. Sales usually slow 4%-5% in May, so the increase was not only uncharacteristic, but also presents a bit of a conundrum in the context of the current economic and freight environments. As owner-operators and smaller fleets in particular exit the industry, inventory continues to increase. This is providing remaining fleets with more options than they have had in a long time, ACT analysts explained.
Auction sales increased 32% in May from the previous month while dealers sold 19% fewer wholesale units. Combined, the total market swelled 13% month over month in May.
Compared to a year ago, the retail market was 17% larger. The auction and wholesale segments also expanded, 43% and 79%, respectively. Their combined performance drove the total market 31% higher than a year ago.
Despite the current anemic economic and soft freight conditions, the comparison highlights just how tough conditions were in 2022 with respect to scarce inventory.
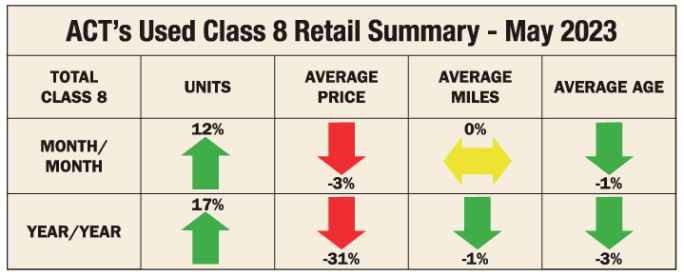
As owner-operators and smaller fleets exit the industry, used-truck inventory continues to increase.
Source: ACT Research
Fleets Still Waiting for New Trailers
At nearly 9,700 units, May net trailer orders slid 4% month over month and were down 51% year over year. Seasonally adjusted orders, at 12,000 units, dropped 27% from the previous month and 50% from last year.
May orders were still in seasonal retreat, coupled with the recent near record-level order backlogs. Dry vans fell 61% year over year, while reefer net orders were negative, as cancellations exceeded orders.
Seasonal expectations suggest orders are likely to remain soft for the coming few months, particularly given near-record-level order backlogs. Although that backlog is falling, most fleets needing trailers are still waiting in line.
As for cancellations, fleet commitments were mixed in June. Total cancels dropped to 2.8% of backlog, from May’s 4.2% rate. Most cancellations have been coming from the dealer network, although fleet and model-year cancellation-rebooks are being reported as the 2024 order boards begin to open and slots get pushed.
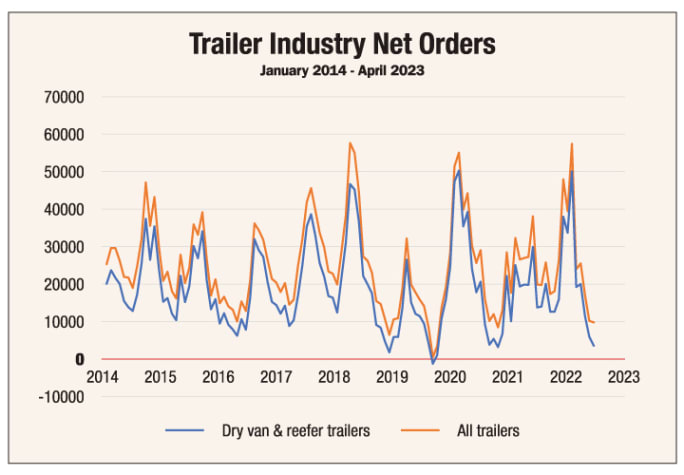
By category, dry van orders in May fell 61% from a year ago. Reefer net orders were negative, as cancellations exceeded orders.
Source: ACT Research
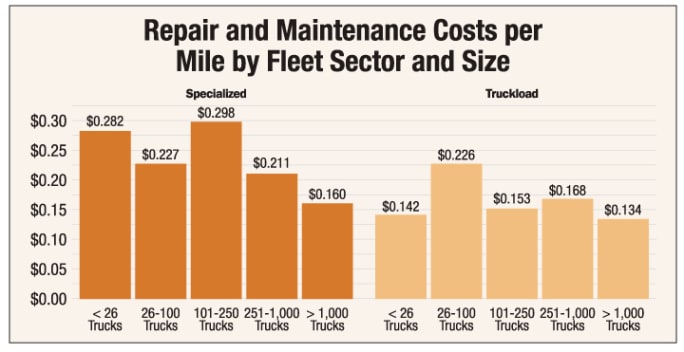
Repair and Maintenance Costs
Repair and maintenance costs rose in 2022 by 12% to an industry average of 19.6 cents per mile, according to the American Transportation Research Institute’s annual costs survey. This rate of increase was slightly lower than the 18% increase in 2021, thanks to carriers’ improved ability to acquire new trucks and decrease average truck age.
This year, ATRI added two new maintenance benchmarks:
- Mileage between unscheduled breakdowns, 50,547.
- Percentage of maintenance conducted in-house: 59%.
It found that carriers that did more of their maintenance in-house tended to have lower repair and maintenance costs per mile. Large carriers are more likely to use in-house service departments. Fleets with more than 1,000 trucks conducted 66% of their maintenance in-house. Fleets with 26 to 100 trucks conducted 51% of their maintenance in-house.
The American Trucking Associations Technology & Maintenance Council, working with Decisiv, found that combined parts and labor expenses rose by 13% between the fourth quarter of 2021 and the fourth quarter of 2022.
That report identified that the greatest contributors to repair and maintenance costs were:
- Powerplants (35.7%)
- Exhaust (14%)
- Brake systems (5.1%)
Subscribe to Our Newsletter
More Equipment
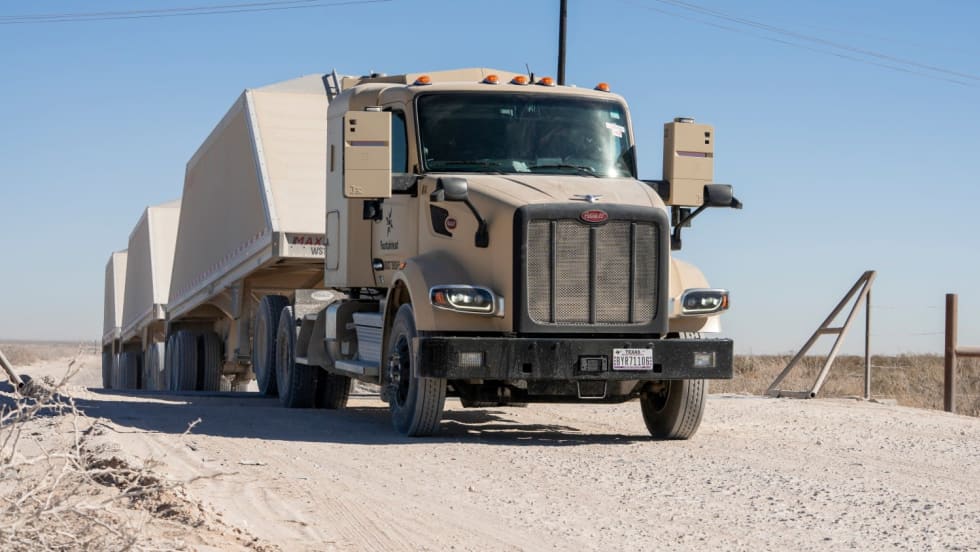
Atlas Expands Kodiak Driverless Truck Fleet in Permian Basin
Atlas Energy Solutions is expanding autonomous frac sand hauling in the Permian Basin with a second load-out location and plans for 100 driverless trucks by mid-2027.
Read More →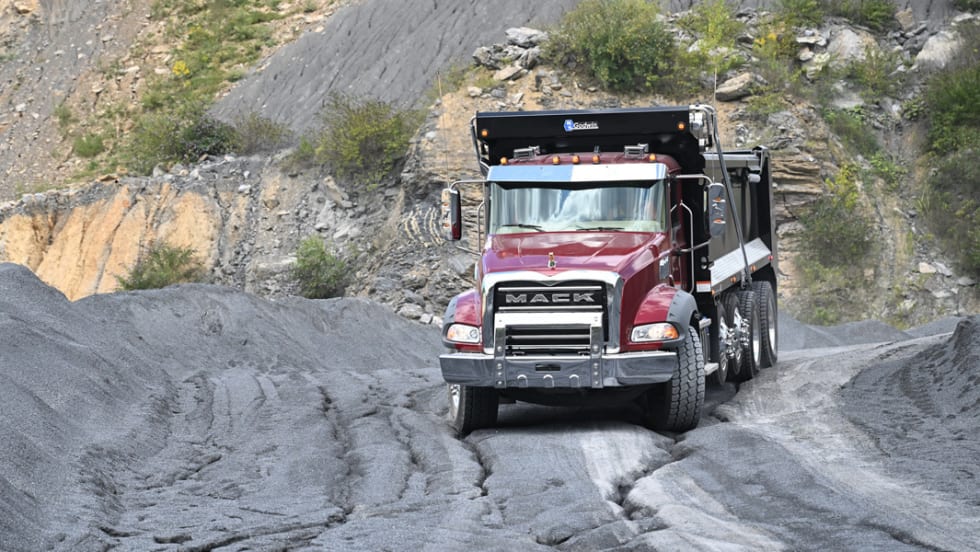
Putting Mack’s Command Steer to the Test
A test drive of Mack’s Command Steer active steering system evaluates how it can make truck driving easier and less tiring.
Read More →
Mack, Volvo Expand DEF Derate Software Updates
The updated software gives Mack and Volvo truck owners more time to address DEF-related issues before the engine derates or the vehicle goes into reduced-speed inducement, following new EPA guidance.
Read More →
Rush, MCT Team Up to Grow Refrigeration Service Network
The joint venture will operate MCT's network of Carrier Transicold dealerships and mobile service locations, with the companies promising greater service capacity and uptime for refrigerated fleets.
Read More →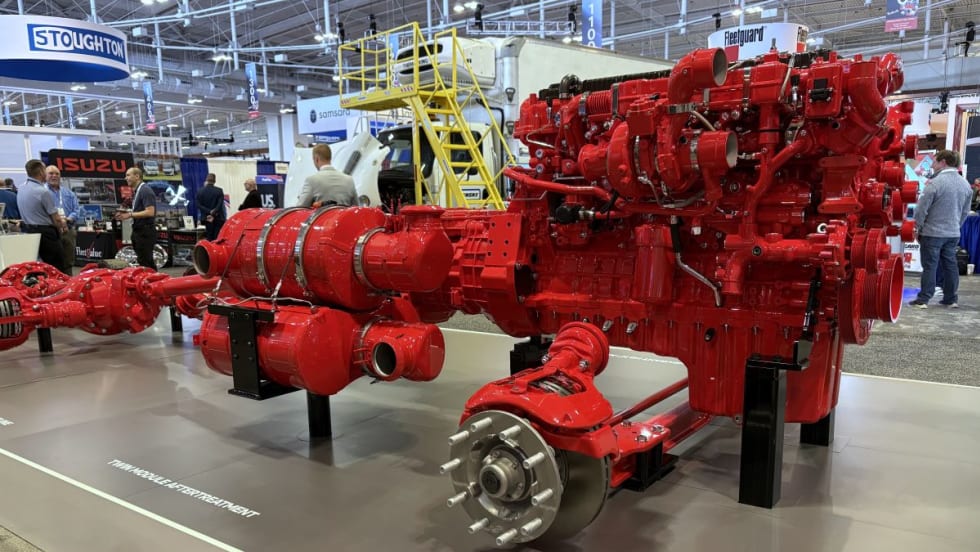
Cummins Adjusts 2027 Engine Rollout After EPA Proposal
The engine maker will gradually introduce its new Model Year 2027 diesel engines while continuing to offer current models during the transition, citing the EPA's proposed emissions rule changes.
Read More →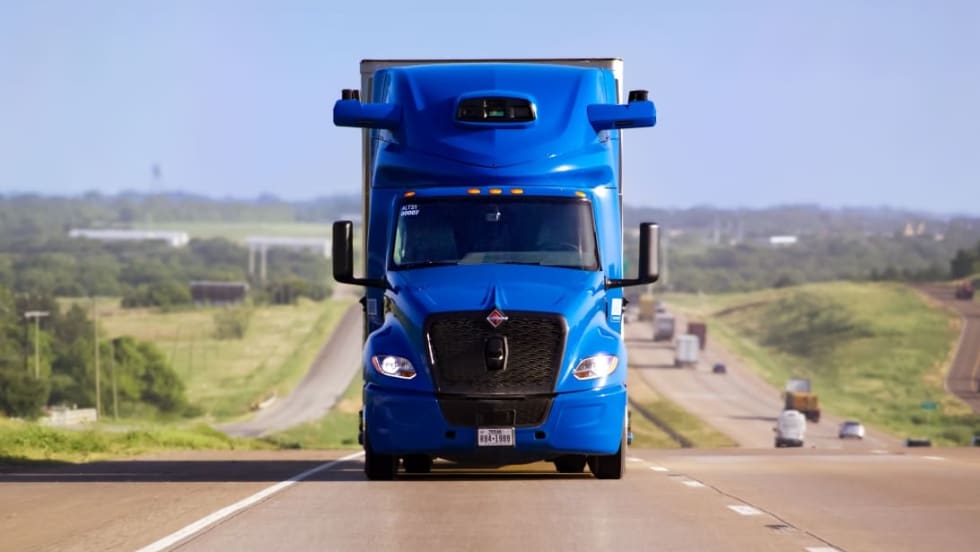
Aurora Rolls Out Next Generation of Driverless Trucks for Commercial Freight
Aurora's latest autonomous trucks it's rolling out with International feature lower-cost hardware designed for a million miles as the company expands commercial driverless freight operations across the U.S. Sun Belt.
Read More →
Peterbilt 589 Spotlight: A Close Look at a Custom Working Truck [Video]
There's more to this customized Peterbilt Model 589 and Great Dane refrigerated trailer than chrome and stainless (although there's plenty of that too!) A veteran driver explains the design choices and practical features behind this working truck.
Read More →
Continental Expands Retread Lineup With New ContiTread HDL 5 EP
New long-haul drive retread is designed to improve fuel efficiency, extend tread life, and lower fleets' cost per mile.
Read More →
EPA Proposal Could Ease 2027 Truck Costs and Buying Uncertainty
The proposal doesn't change the tougher NOx standard, but it would revise key implementation requirements that manufacturers say have driven up costs and complicated fleet purchasing decisions.
Read More →
Cummins, Paccar Ease DEF Derates After EPA Guidance
Updated diesel engine software gives truck operators more time to address emissions-system issues while staying compliant with EPA emissions standards.
Read More →