HDT Fact Book 2022: High Fuel Prices, Market Shifting Mark Industry Trends
Trucking has long been viewed as an early indicator of economic cycles, but the pandemic and other global issues have clouded the picture. Here’s the latest industry data from HDT’s 2022 Fact Book.
The conditions that led to soaring trucking conditions, rates, and profits last year are largely history at this point. Where things go from here, as the Fed raises interest rates to slow the economy and address record inflation, is unclear. Trucking has long been viewed as an early indicator of economic cycles, but the pandemic and other global issues have clouded the picture.
Employment data from recent months suggest that drivers are readily available for larger carriers, although much of that growth is likely coming at the expense of very small carriers that are failing due to record diesel prices and normalizing spot rates. Those weaker spot market rates and skyrocketing fuel costs during the first half of 2022 overshadowed strong freight volumes overall and record-high prices for loads moving under contract.
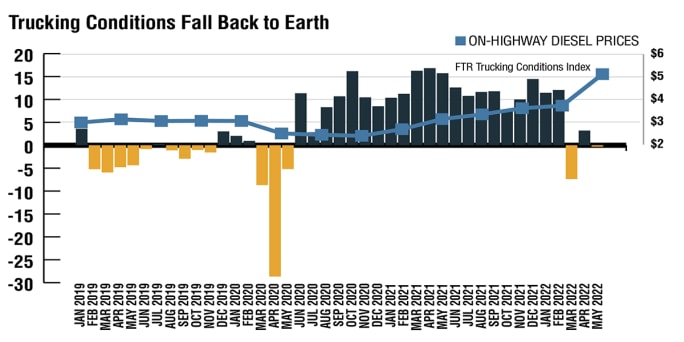
Sharp increases in diesel prices in the first half of 2022 are the main reason trucking conditions aren’t soaring like they were a year ago. FTR’s Trucking Conditions Index tracks changes in five areas affecting the U.S. truckload market: freight volumes, freight rates, fleet capacity, fuel price, and financing. FTR’s outlook is for conditions to continue close to neutral territory, with index readings in either low positive or low negative figures from month to month.
Sources: FTR, Energy Information Administration
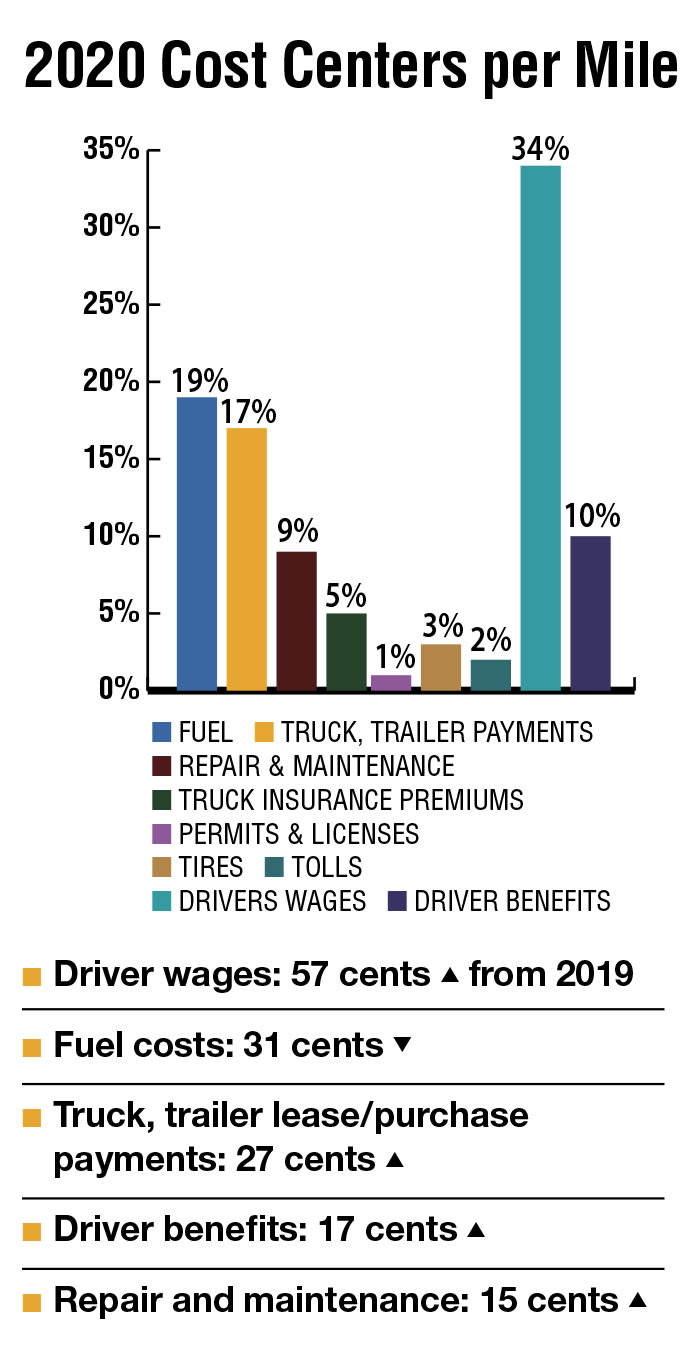
The top five costs per mile in 2020 stayed relatively consistent compared to the same numbers in 2019. Most of the costs, except fuel, rose slightly. The largest single line-item cost continued to be driver wages, representing 34% of operating costs.
Source: American Transportation Research Institute, “An Analysis of the Operational Costs of Trucking” Report
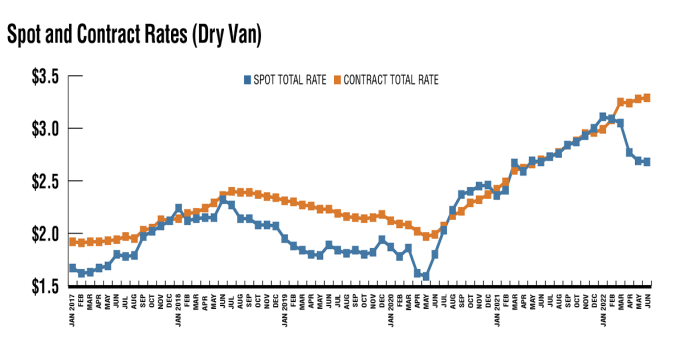
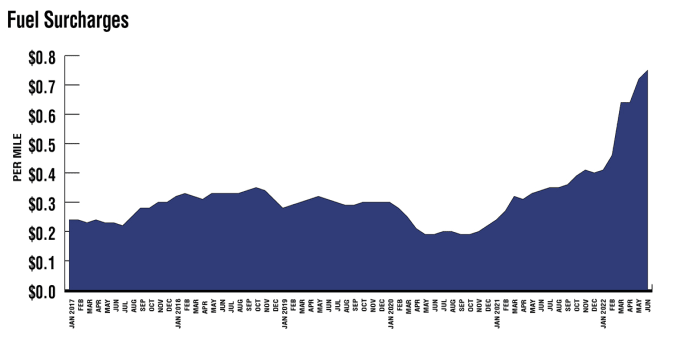
Shippers are paying historically high truckload rates to ensure that more of their loads move under contract, reducing demand for trucks on the spot market. The galloping spot market we saw in the wake of COVID-19 and supply chain challenges led to the growth of small carriers with their own authority. But high fuel prices and the slide in spot rates have had a profound for small trucking companies and owner-operators that use the spot market, explains DAT. Spot rates do not include a separate fuel surcharge, which makes it difficult for carriers to ensure that the rate they negotiate will adequately cover their fuel costs.
Contract rates and fuel surcharges have risen sharply so far this year, with June seeing record surcharges and contract rates. Spot rates, after a meteoric rise during the pandemic, have softened. Shippers are paying historically high truckload rates to ensure that more of their loads move under contract, reducing demand for trucks on the spot market.
Source: DAT Freight & Analytics
Meanwhile, since spot rates don’t have official fuel surcharges and diesel prices have hit record highs this year, carriers on the spot market are likely keeping less of that revenue, according to DAT.
Source: DAT Freight & Analytics
Source: DAT Freight & Analytics
“Shippers are seeing increased routing guide compliance at the same time truckers on the spot market are contending with extreme volatility in lower rates and higher fuel costs,” said Ken Adamo, DAT’s Chief of Analytics. “We expect these conditions to continue. However, we have yet to see the glut of capacity and overall lack of freight that produced a prolonged down-cycle in late 2018 and 2019.”
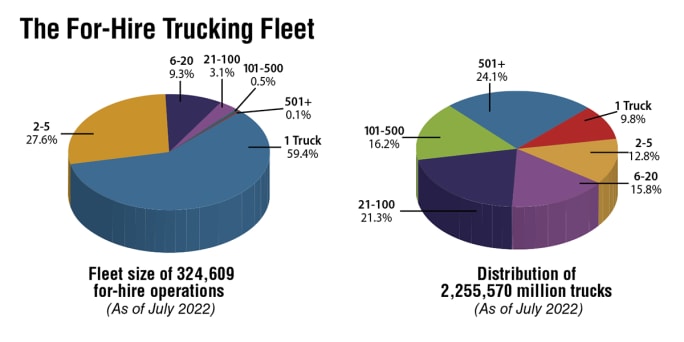
Despite challenges in truck production, the for-hire trucking fleet grew in the past year and a half, mostly among small fleets. The number of carriers grew from 196,228 in January 2021 to 324,609 in July 2022. The number of trucks grew from 1.97 million to nearly 2.6 million. The percentage of one-truck carriers grew some 10 percentage points, from 49% to 59%. Notes: Excludes private fleets that also hold for-hire authority. Excludes parcel carriers such as UPS, FedEx Ground. Includes only carriers holding active FMCSA authority as of the snapshot date. Carriers are required to update their profile only once every two years and do so on a staggered schedule.
Source: FTR analysis of FMCSA MCMIS database snapshots, March 2020 and July 2022
Comparing a snapshot of pre-pandemic numbers from March 2020 with the most recent, July 2022, illustrates the growth among the smallest operations, due mostly to the surge in new carriers as drivers and leased owner-operators left larger carriers and got their own authority in order to take advantage of booming spot rates. In March 2020, one-truck fleets owned just under 6% of the trucks. By July 2022 that was 8.6%. However, even the largest carriers have seen growth. Notes: Excludes private fleets that also hold for-hire authority. Excludes parcel carriers such as UPS, FedEx Ground. Includes only carriers holding active FMCSA authority as of the snapshot date. Carriers are required to update their profile only once every two years and do so on a staggered schedule.
Source: FTR analysis of FMCSA MCMIS database snapshots, March 2020 and July 2022
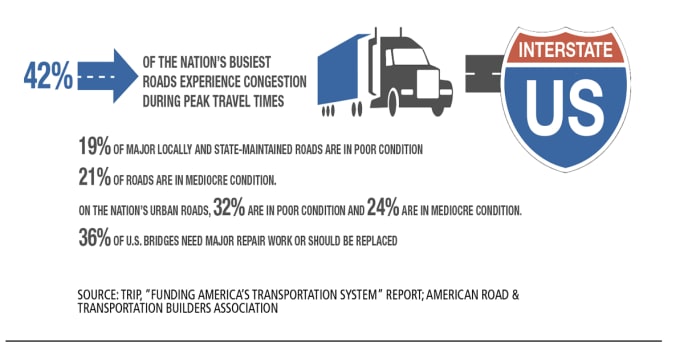
The Constrained Highway System
As U.S. vehicle miles of travel (VMT) return to pre-COVID-19 levels, the nation’s highways are again congested, hindering the movement of people and goods.
Despite the increase in transportation funding provided by the passage of the bipartisan Infrastructure Investment and Jobs Act in November 2021, the nation’s roads and bridges remain significantly underfunded and will require increased investment for needed improvements and repairs, TRIP, a national transportation research nonprofit, found in a report.
Nearly 224,000 U.S. bridges need major repair work or should be replaced, according to the American Road & Transportation Builders Association’s analysis of the U.S. Department of Transportation 2021 National Bridge Inventory database. If placed end-to-end, these bridges would stretch over 6,100 miles.
Source: TRIP, “Funding America’s Transportation System” Report; American Road & Transportation Builders Association
This data and analysis first appeared in the August 2022 special Fact Book issue of Heavy Duty Trucking.
2022 Fact Book
The Trucking Industry Numbers Impacting the Bottom Line
Heavy Duty Trucking’s annual Fact Book is designed to provide a snapshot of the current state of the industry, where it’s been, and where it’s going. 2022 is the eighth year for the HDT Fact Book. Dive into the other topics:
When it gets harder for a freight broker to prove they are financially sound, the ones who cannot clear that bar get pushed out of the market. And those are exactly the brokers who used to leave motor carriers holding the bag.
For trucking, the bridge opening should offer immediate improvements in efficiency and reliability, with new customs facilities, expanded inspection capacity, and direct freeway-to-freeway connections.
Aurora's latest autonomous trucks it's rolling out with International feature lower-cost hardware designed for a million miles as the company expands commercial driverless freight operations across the U.S. Sun Belt.
Shadow AI — the use of unauthorized artificial intelligence tools at work — is becoming increasingly common, putting sensitive company data at risk. Learn how trucking fleets can protect sensitive data while embracing AI.
The company will bring three business units under the ArcBest brand, eliminate about 2% of positions, and expects the changes to generate $40 million in annual savings.
ATRI's annual operational cost report shows carriers trimmed fleets, delayed equipment purchases, and ran older trucks as expenses continued to outpace freight rates.
The National Retail Federation projects July container imports will surpass the pandemic-era record as shippers frontload freight ahead of expected August tariff increases.