



Researchers Identify Nation's Most Congested Corridors
The 2011 Congested Corridors Report is the first nationwide effort to identify reliability problems at specific stretches of highway responsible for significant traffic congestion at different times and different days
The 2011 Congested Corridors Report is the first nationwide effort to identify reliability problems at specific stretches of highway responsible for significant traffic congestion at different times and different days.
The report was published by the Texas Transportation Institute of Texas A&M University. Congestion data and analytics were provided by INRIX, a leading-provider of traffic information.
INRIX originated the corridor approach to congestion analysis, using 10 hours of congestion per week to define a starting point for a congested corridor. To be considered a "corridor," according to the INRIX standard adopted for this report, congestion should impact a freeway segment at least three miles long.
"Until now, we've been able to measure average congestion levels," noted TTI Research Engineer, Bill Eisele, "but congestion isn't an 'average' problem. Commuters and truckers are understandably frustrated when they can't count on a predictable trip time from day to day."
Eisele credited the data and corridor listing provided by INRIX with making it possible for researchers to quantify traffic congestion, and the more frustrating variation in congestion from day to day in major urban areas across the country.
The report describes congestion problems in 328 seriously congested corridors over a variety of times -- all day, morning and evening peaks, midday, and weekends. Much of our national congestion problem exists in a relatively small amount of our freeway system, the report shows.
Researchers investigated all freeways and highways in the U.S. looking for traffic problems. A short directional roadway segment (less than 1 mile) with congestion for more than 10 hours in a week was the beginning definition of a congested corridor. "Congestion" was deemed as having a speed less than half of the free-flow speed.
Not only were these roads found to have more stop-and-go traffic than others, they were also much less predictable.
"Not only [do particular trips] take longer, commuters and truckers have a difficult time knowing how much longer it will take each time they make the same trip," said report co-author, David Schrank.
Among the report's key findings:
- The 328 corridors, while accounting for only 6% of the nation's total freeway lane-miles and 10 percent of the traffic volume, account for 36% of the country's urban freeway congestion;
- The 328 corridors account for 8% of the national truck traffic and 33% of urban freeway truck delay;
- Travel time reliability is more of a problem around bridges, tunnels and toll facilities, both because there are few alternate routes available in such circumstances and because a small incident can have a huge effect on corridor travel times;
- When travel time variability increases, trips becomes less predictable. Every occurrence of an unpredicted travel disruption creates slower speeds than normal and contributes to an increase in our reliability measures.
As the first national look at travel time reliability, researchers believe that the report can be useful in determining where transportation system improvements will have the greatest impact.
Among the conclusions presented in the report, researchers suggest there is no one single best solution to congestion. Rather, they say the best approach is to examine a variety of solution that would each contribute to an overall reduction in congestion. Options include:
- Traditional road building and new or expanded transit facilities;
- Traffic management strategies such as aggressive crash removal;
- Demand management strategies like improving commuter information and employer-based ideas such as telecommuting and flexible work hours; and
- Denser development patterns with a mix of jobs, shops and homes so people can walk, bike or take transit to more and closer, destinations.
The researchers stress that there is no single best way to fix the problem. The best solutions, they say, will come from efforts that have meaningful involvement from everyone concerned -- agencies, businesses and travelers.
"If cities and states make the right investments in our most congested highway corridors, the return on those investments will be substantial," says study author Tim Lomax. "Not only will we see more reliable trips for travelers and trucks, but we can also expect to see greater productivity and more jobs."
The full report is available here.
Top 10 Corridors Deemed Most Reliably Unreliable
1) Atlanta: GA Hwy.400 SB between the Toll Plaza and I-85/Exit 87.
2) Atlanta: the I-75 SB between Mount Zion Pkwy./Exit 231 and Hudson Bridge Rd./Exit 224.
3) New York: Hutchinson River Pkwy. NB between the Cross County Pkwy./Exit 15 and Mamaroneck Rd./Exit 22.
4) New York: the Bronx Whitestone Bridge NB/Whitestone Expy. NB between Linden Pl./Exit 14 and the Toll Plaza.
5) Norfolk: the Hampton Roads Beltway/I-64 EB between Rip Rap Rd./Exit 265 and Hampton Roads Bridge Tunnel at Hampton.
6) New York: the Pulaski Skwy. NB between I-95/Exp US-1 and Tonnele Ave.
7) New Haven: the I-84 WB between I-691 (Cheshire) (West) and Austin Rd./Exit 25A.
8) Houston: the N Loop W Fwy/I-610 EB between US Hwy. 290 and Yale St.
9) Pittsburgh: the Penn Lincoln Pkwy./I-376 EB between Lydia St./Exit 2 and US Hwy. 19/PA-51/Exit 5.
10 Riverside, CA: the Ontario Fwy/I-15 NB between I-210/Exit 115 and Glen Helen Pkwy.
Top 10 Corridors with the Worst Congestion Overall
1) Los Angeles: the Harbor Fwy. / CA Hwy. 110 NB from I-10/Santa Monica Fwy. and Stadium Way at Exit 24C.
2) Los Angeles: the Harbor Fwy./I-110 NB between 111th Pl. and I-110/I-10/Santa Monica Fwy.
3) Los Angeles: the San Diego Fwy./I-405 NB between I-105/Imperial Hwy. and Getty Center Dr.
4) New York: the Van Wyck Expy./I-678 NB between Belt Pkwy./Exit 1 Main St./Exit 8.
5) Los Angeles: San Gabriel River Fwy./I-605 SB between Beverly Blvd. and Florence Ave.
6) Los Angeles: the Santa Monica Fwy./I-10 EB between CA Hwy. 1/Lincoln Blvd./Exit 1B and Alameda St.
7) Los Angeles: the Santa Monica Fwy./I-10 WB between I-5/Golden State Fwy. and National Blvd.
8) San Francisco: the I-80 EB (James Lick Fwy./Bay Bridge) between US-101 and Treasure Island Rd.
9) San Francisco: the Grove Shafter Fwy./CA Hwy. 24 WB between Saint Stephens Dr. and the Caldecott Tunnel.
10) Los Angeles: the I-110 SB between W. Vernon Ave. and 51st St.
Top 10 Corridors with the Highest Concentration of Heavy Trucks
1) Los Angeles: the Harbor Fwy/CA Hwy.110 NB between I-10/Santa Monica Fwy. and Stadium Way/Exit 24C.
2) Los Angeles: the Harbor Fwy/I-110 NB between 111th Pl. and I-110/I-10/Santa Monica Fwy.
3) Los Angeles: the San Diego Fwy/I-405 NB between I-105/Imperial Hwy. and Getty Center Dr.
4) New York: the Van Wyck Expy./I-678 NB between Belt Pkwy./Exit 1 and Main St/Exit 8.
5) New York: the I-278 EB (Gowanus Expy./Brooklyn Queens) between 92nd St./Exit 17 and Apollo St./Meeker Ave/Exit 34.
6) Los Angeles: the San Gabriel River Fwy/I-605 SB between Beverly Blvd. and Florence Ave.
7) Los Angeles: the Riverside Fwy/CA Hwy. 91 EB between CA Hwy. 55/Costa Mesa Fwy. and Mckinley St.
8) New York: the I-278 WB (Brooklyn Queens/Gowanus Expy) between NY Hwy.25A/Northern Blvd/Exit 41 and NY Hwy. 27/Prospect Expy./Exit 24.
9) Los Angeles: the Santa Monica Fwy./I-10 EB between CA Hwy. 1/Lincoln Blvd/Exit 1B and Alameda St.
10) Los Angeles: the Santa Monica Fwy./I-10 WB between I-5/Golden State Fwy. and National Blvd.
More Drivers

When Language Stops the Truck: The Return of ELP Out-of-Service Orders
English language proficiency rules for commercial drivers aren’t new, but renewed out-of-service enforcement has raised the stakes. Here’s what carriers need to know before a driver reaches a roadside inspection.
Read More →
Samsara Launches Custom AI Agent Builder
Agent Studio lets fleets create AI tools for hours-of-service monitoring, reporting and driver support, including agents that communicate by phone.
Read More →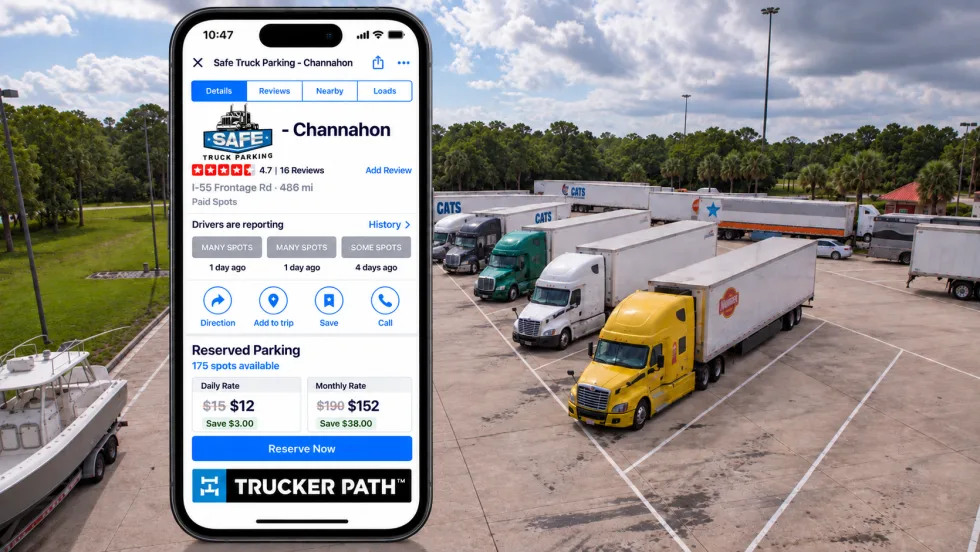
Trucker Path Expands Reserved Parking Network
Trucker Path has added close to 6,000 more truck parking spaces to its Trucker Path Reserved Parking Network with the addition of Safe Truck Parking.
Read More →
EEOC Sues Texas Trucking Company Over Driver Age Limits
The agency says Trancasa USA rejected applicants over 65 and applied tougher driving-record standards to those over 60.
Read More →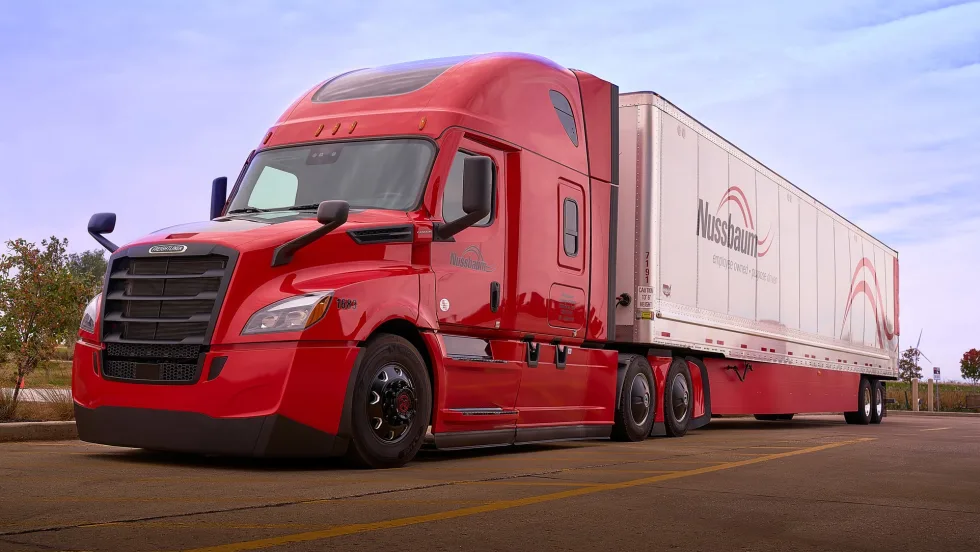
Nussbaum, Roehl Announce Second Driver Pay Increase This Year
This year has seen a swath of major truck driver pay increases as freight capacity has tightened.
Read More →
From One Generation to the Next: How Mentorship Builds Safer Truck Drivers
After three decades in trucking, Harold Perry shares what he's learned about driver safety, mentorship, and helping the next generation build confidence behind the wheel.
Read More →
Truck Drivers Need More Than Another Alert
Fleets have more visibility into truck health, safety events, and driver activity than ever. The next challenge is turning all that information into useful guidance for the person who has to decide what to do next.
Read More →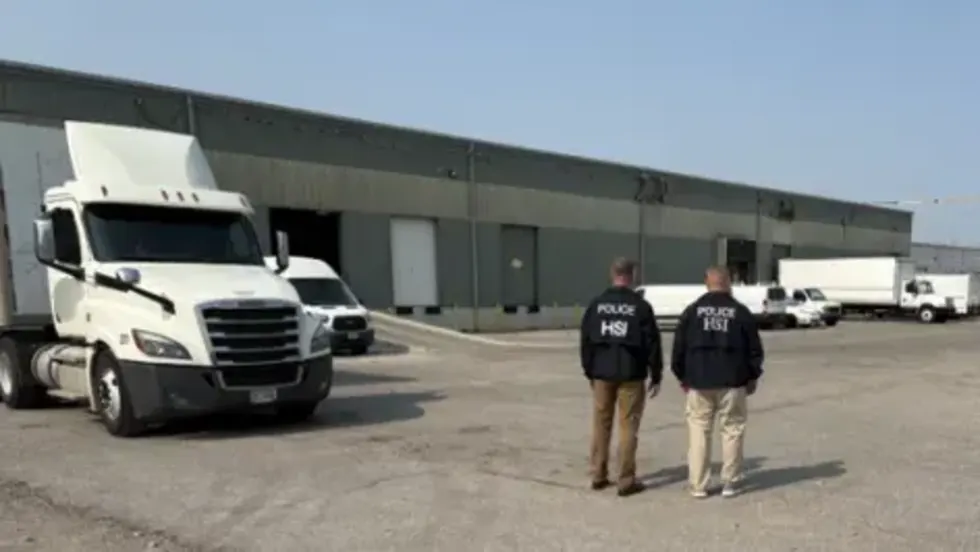
FMCSA Removes 110 Truck Driver Training Schools from Certified ELDT List
Federal regulators also are targeting more than 160 additional training providers and launching a nationwide audit of third-party CDL skills testers as part of a broader crackdown on trucking fraud.
Read More →
Hours of Service Pilot Programs: FMCSA Readies for 2027 Rollout
Two pilot programs could eventually reshape hours-of-service rules, giving truck drivers options to pause their 14-hour clock or use longer split sleeper rest periods.
Read More →
Medical Cards, English Proficiency Reshape Roadcheck Violations
Medical-card violations jumped to the top of the driver out-of-service list during CVSA’s 2026 International Roadcheck, while English-language proficiency violations appeared among the leading violations for the first time.
Read More →