



Economic Recovery Bringing Renewed Congestion Growth
After two years of slight declines in overall traffic congestion - attributable to the economic downturn and high fuel prices - leading indicators suggest that as the economy rebounds, traffic problems are doing the same. While 2008 was the best year for commuters in at least a decade, the problem again began to grow in 2009
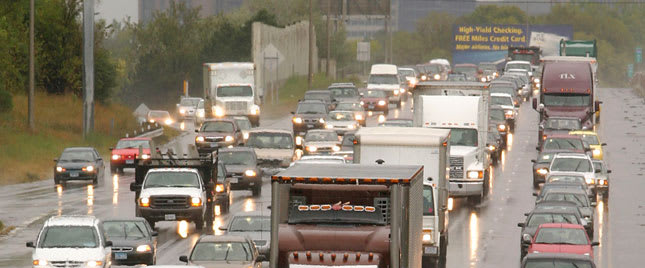
If the recession had you thinking congestion was getting better, think again. (Photo courtesy Michelin.)
After two years of slight declines in overall traffic congestion - attributable to the economic downturn and high fuel prices - leading indicators suggest that as the economy rebounds, traffic problems are doing the same. While 2008 was the best year for commuters in at least a decade, the problem again began to grow in 2009.
The 2010 Urban Mobility Report, published by the Texas Transportation Institute at Texas A&M University, paints a more accurate picture of traffic congestion in the 439 U.S. urban areas. Thanks to the wealth of speed data provided by INRIX, a private-sector provider of travel time information, the current report offers a greatly enhanced picture of congestion on a city-by-city basis, according to researchers.
"This Urban Mobility Report begins an exciting new era for comprehensive national congestion measurement," noted researcher Tim Lomax. "By combining the traffic speed data from INRIX with the traffic volume data from the states, we are now able to provide a much better and more detailed picture of the problems facing urban travelers."
Highlights from the research illustrate the effects of the nation's traffic problems:
* Congestion costs continue to rise: measured in constant 2009 dollars, the cost of congestion has risen from $24 billion in 1982 to $115 billion in 2009.
* The total amount of wasted fuel in 2009 topped 3.9 billion gallons - equal to 130 days of flow in the Alaska Pipeline.
* Cost to the average commuter: $808 in 2009, compared to an inflation-adjusted $351 in 1982.
* Yearly peak delay for the average commuter was 34 hours in 2009, up from 14 hours in 1982.
"We have a great deal more confidence in the numbers we now have for the chaotic years of 2007, 2008 & 2009," researcher Shawn Turner said. "Thanks to technology, we are using data that simply could not have been gathered a few years ago."
The methodology used to calculate congestion has been improved more than a dozen times since the Urban Mobility Report was first published in 1984, but the changes made possible by access to hour-by-hour speed data are the most significant improvement yet, researchers say.
"This year's report is a remarkable game changer," researcher David Schrank explained. "The new data address the biggest shortcoming of previous reports. The data show conditions for every day of the year and include the effect of weather problems, traffic crashes, special events, holidays, work zones and other factors directly impacting traffic flow."
As a result of the new data, a revised congestion trend has been constructed for each urban region from 1982 to 2009. Eleven new urban regions have been added.
Researchers recommend a balanced and diversified approach to reducing traffic congestion - one that focuses on more of everything. Their strategies include:
* Get as much use as possible out of the transportation system we have.
* Add roadway and public transportation capacity in the places where it is needed most.
* Change our patterns, employing ideas like ridesharing and flexible work times to avoid traditional "rush hours."
* Provide more choices, such as alternate routes, telecommuting and toll lanes for faster and more reliable trips.
* Diversify land development patterns, to make walking, biking and mass transit more practical.
* Adopt realistic expectations, recognizing for instance that large urban areas are going to be congested, but they don't have to stay that way all day long.
"There is no rigid prescription - no 'best way' - to address congestion problems," Lomax noted.
"The most effective strategy is one where agency actions are complemented by efforts of businesses, manufacturers, commuters and travelers. Each region must identify the projects, programs and policies that achieve goals, solve problems and capitalize on opportunities."
More Drivers
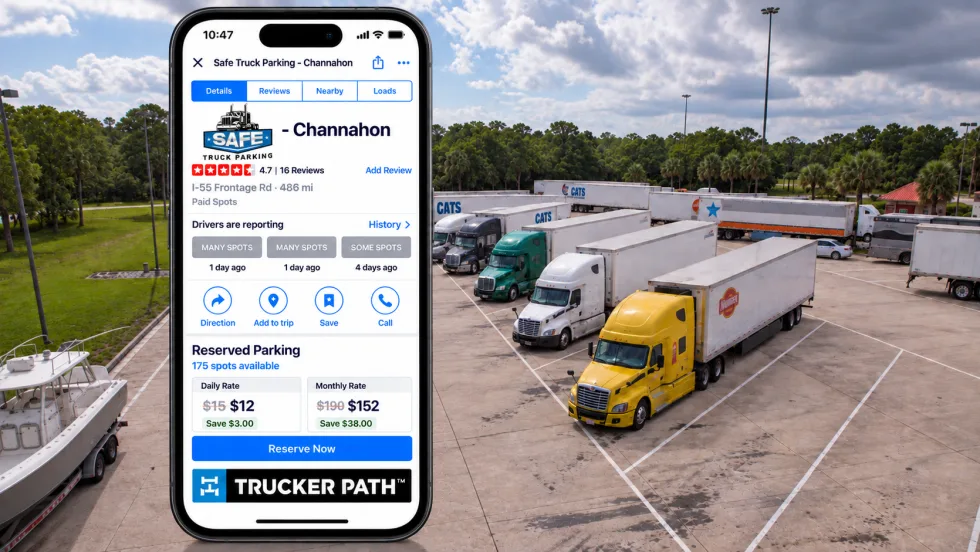
Trucker Path Expands Reserved Parking Network
Trucker Path has added close to 6,000 more truck parking spaces to its Trucker Path Reserved Parking Network with the addition of Safe Truck Parking.
Read More →
EEOC Sues Texas Trucking Company Over Driver Age Limits
The agency says Trancasa USA rejected applicants over 65 and applied tougher driving-record standards to those over 60.
Read More →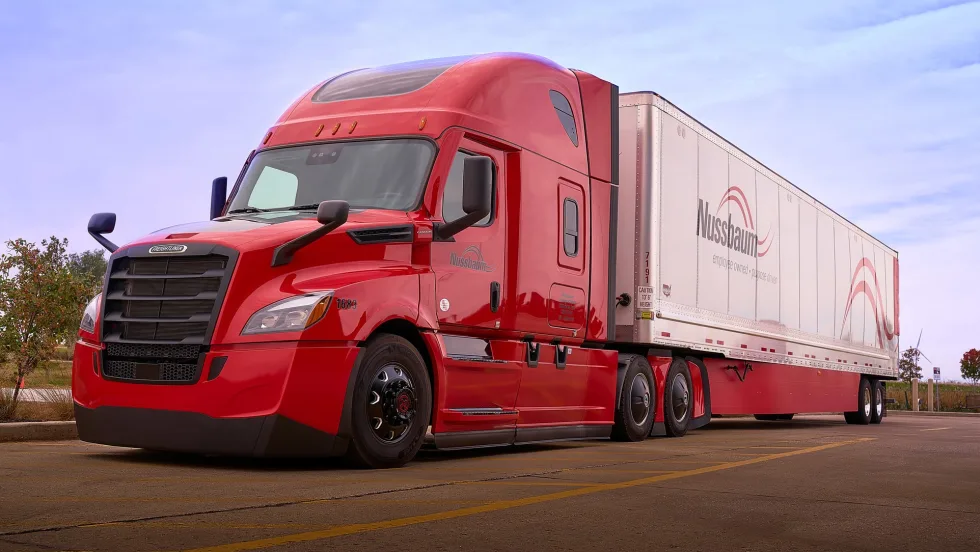
Nussbaum, Roehl Announce Second Driver Pay Increase This Year
This year has seen a swath of major truck driver pay increases as freight capacity has tightened.
Read More →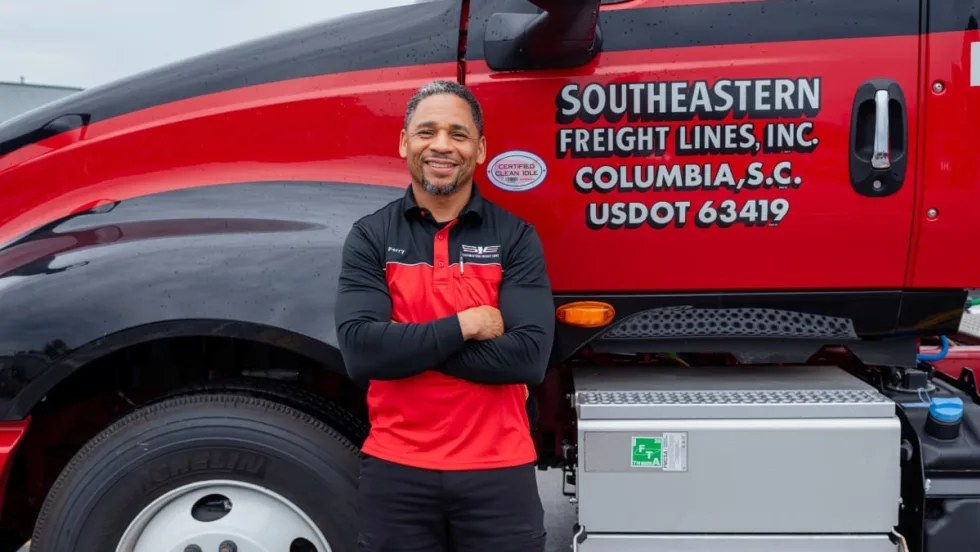
From One Generation to the Next: How Mentorship Builds Safer Truck Drivers
After three decades in trucking, Harold Perry shares what he's learned about driver safety, mentorship, and helping the next generation build confidence behind the wheel.
Read More →
Truck Drivers Need More Than Another Alert
Fleets have more visibility into truck health, safety events, and driver activity than ever. The next challenge is turning all that information into useful guidance for the person who has to decide what to do next.
Read More →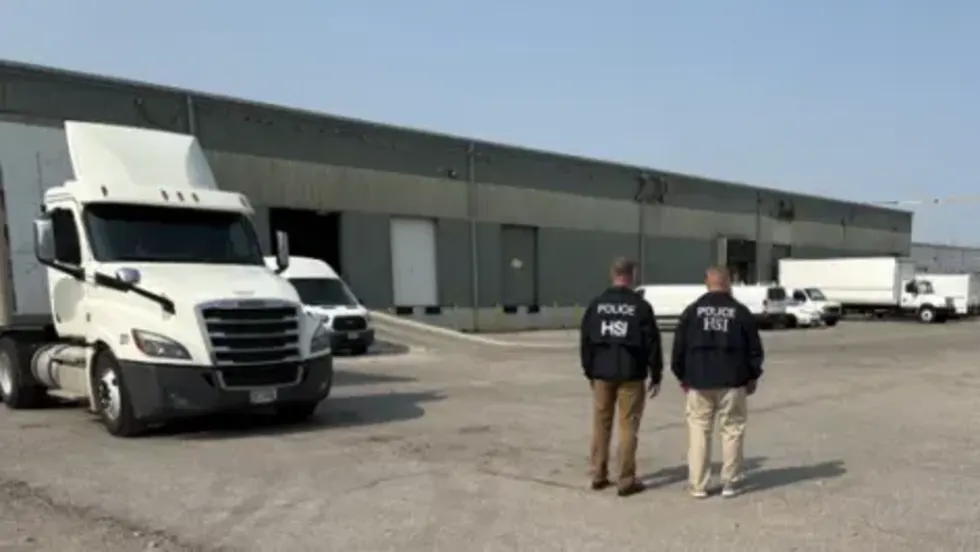
FMCSA Removes 110 Truck Driver Training Schools from Certified ELDT List
Federal regulators also are targeting more than 160 additional training providers and launching a nationwide audit of third-party CDL skills testers as part of a broader crackdown on trucking fraud.
Read More →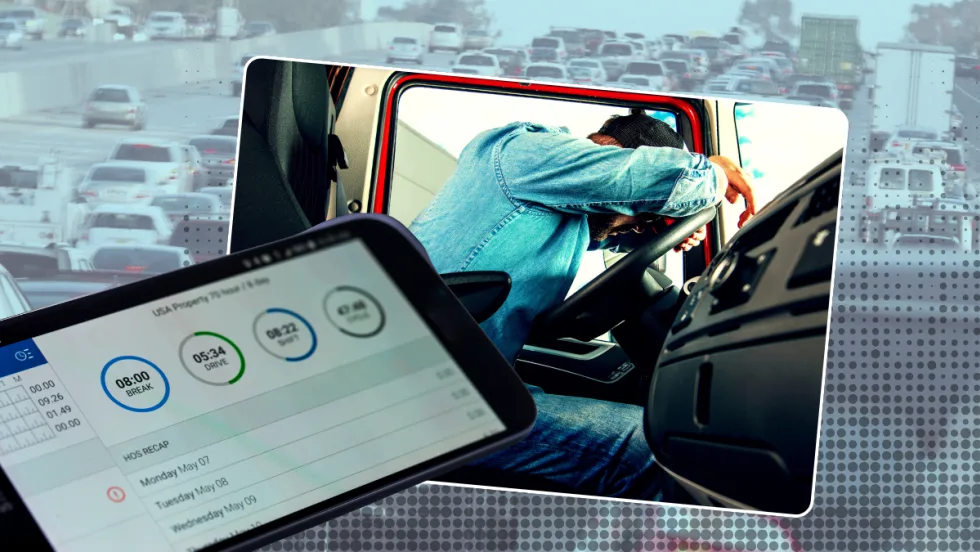
Hours of Service Pilot Programs: FMCSA Readies for 2027 Rollout
Two pilot programs could eventually reshape hours-of-service rules, giving truck drivers options to pause their 14-hour clock or use longer split sleeper rest periods.
Read More →
Medical Cards, English Proficiency Reshape Roadcheck Violations
Medical-card violations jumped to the top of the driver out-of-service list during CVSA’s 2026 International Roadcheck, while English-language proficiency violations appeared among the leading violations for the first time.
Read More →
Driver Trust Can Make or Break the Success of Fleet Safety Technology
New Teletrac Navman research suggests that onboarding, transparency about driver data, and positive feedback can play a significant role in how commercial drivers respond to safety and coaching technology.
Read More →
EEOC Sues KLLM Over Alleged Sex Discrimination in Driver Training
KLLM is facing a federal sex-discrimination lawsuit over policies the EEOC alleges put female truck driver trainees at a disadvantage.
Read More →