

Study: State Enforcement Differences Undermine CSA Uniformity
A new study has confirmed that state enforcement disparities create uneven safety playing fields for motor carriers that have different operating patterns and mileage exposure in the lower 48 states.
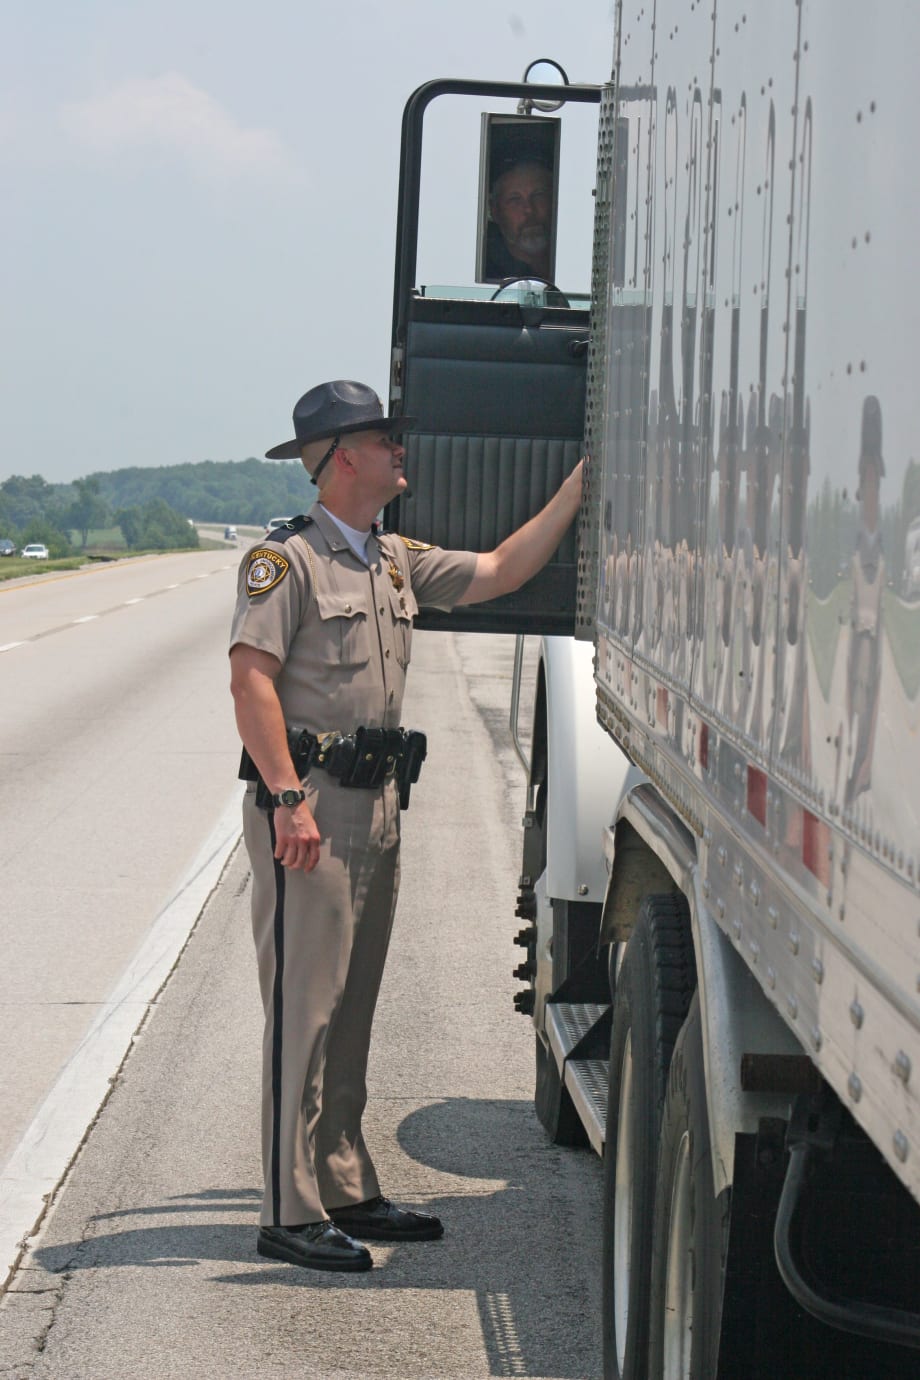
Differing truck enforcement between states means CSA numbers are not consistent, study finds. File Photo: Kentucky State Police

A new study has confirmed that state enforcement disparities create uneven safety playing fields for motor carriers that have different operating patterns and mileage exposure in the lower 48 states.
The American Transportation Research Institute, the research arm of the American Trucking Associations, this week released its study, Evaluating the Impact of Commercial Motor Vehicle Enforcement Disparities on Carrier Safety Performance.
“This assessment was ranked as the number one research issue for the industry during our annual [Research Advisory Committee] meeting in 2013 and its impact on the industry should be significant," said ATRI Research Advisory Committee Chairman Steve Niswander, who's also vice president of safety policy and regulatory relations for Oklahama-based tank carrier Groendyke Transportation.
ATRI says the analysis documents the necessity for some flexibility in developing enforcement strategies specific to a state’s needs, but also confirms that state enforcement disparities create uneven safety playing fields for carriers that have different operating patterns and mileage exposure in the lower 48 states.
Furthermore, the study finds, the different priorities and violation issuance rates across states dramatically undermine the uniformity of CSA – a supposedly standardized safety assessment program.
By simply crossing into an adjoining state, carrier BASIC scores can change markedly. For example, ATRI’s model calculated one carrier’s Hours-of-Service percentile decreasing by 4.2 points, but their Vehicle Maintenance percentile increasing by 12.2 points if state violation rates were normalized.
Finally, based on two nationally recognized violation lists most closely associated with future crash risk, ATRI’s research documents considerable variability in state emphasis on those violations that generate the greatest safety benefit.
ATRI’s research findings generate from four specific tasks:
State Data Metrics Compendium which compares and contrasts several dozen safety and operational metrics for the lower 48 states.
Relating Violations to Crash Risk Analysis reveals that while certain violations have a stronger relationship to crash risk, these violations may not be equitably emphasized across states.
State Enforcement Objective Case Studies evaluate the impact of six specific state enforcement priorities on actual safety outcomes.
Carrier Case Studies quantify the impact of state enforcement disparities on specific motor carrier safety measures within the Safety Measurement System (SMS), based on an ATRI-developed model that assesses the impact that standardizing state enforcement activities would have on SMS scores across seven carriers.
“ATRI’s study unequivocally quantifies what we know is a serious defect in the CSA scoring system – that carrier safety performance as represented by BASIC scores can be dramatically impacted by the states in which a carrier operates based on nothing more than the states’ varying enforcement priorities," says Brett Sant, Knight Transportation’s vice president of safety and risk management and a member of ATRI’s Research Advisory Committee.
"Until these disparities are rectified, peer-based comparisons within CSA’s scoring system will continue to be flawed and of little value as a tool for monitoring carrier and driver safety performance unless accounted for properly."
A copy of the study results is available from ATRI at www.atri-online.org.
More Safety & Compliance

Brake Safety Week to Focus on Drums and Rotors
Commercial vehicle inspectors will be focusing on brakes during CVSA's Brake Safety Week, August 23-29.
Read More →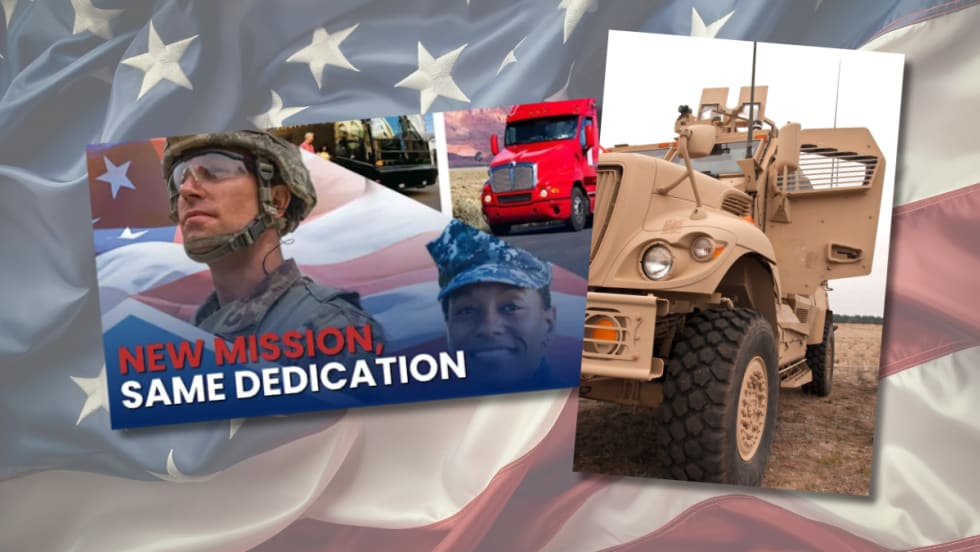
Trump Administration Looks to Put More Veterans Behind the Wheel
The Freedom Haulers program pulls together existing and expanded programs at several federal agencies to recruit veterans to drive commercial heavy-duty trucks and cut the red tape for them to get a CDL, training, and employment.
Read More →
$604 Million Verdict Tests Broker Liability After Supreme Court Ruling
C.H. Robinson plans to appeal after a Texas jury found it bore the largest share of responsibility for a fatal 2021 crash, in a case that follows the Supreme Court's Montgomery decision allowing negligent hiring claims against freight brokers.
Read More →
How Fraley & Schilling Improved Logbook Compliance by Over 50%
Fraley & Schilling needed a way to close a compliance workflow gap in its ELD system without adding more work from driver training, reminders, and back-office follow-ups. It found the answer in a custom driver app.
Read More →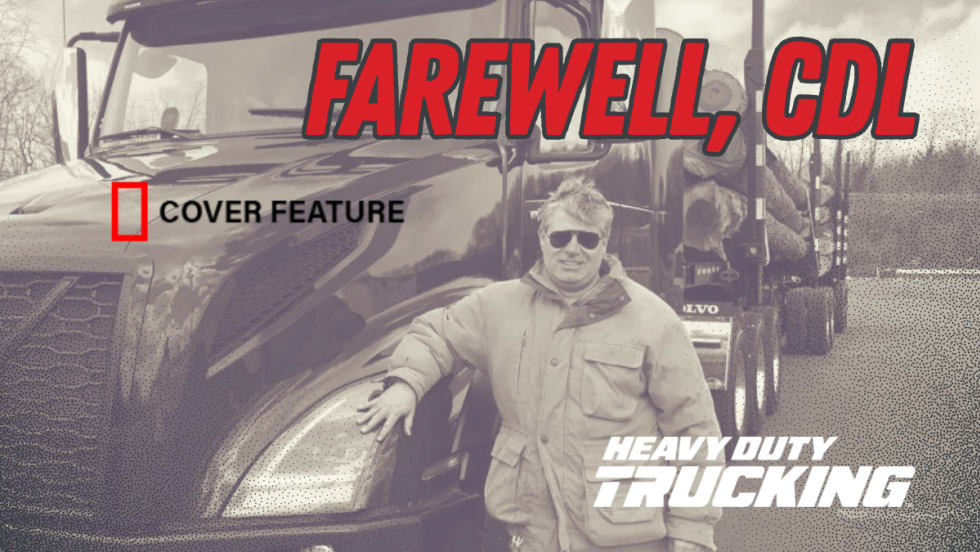
Farewell, CDL: Why I'm Giving Up My Commercial Driver's License
After more than 20 years as a CDL holder, HDT Executive Editor Jack Roberts is letting his commercial license expire. Not because he wants to — but because trucking's nuclear verdict crisis has made the risks of public-road test drives too great for editors, manufacturers, and everyone involved.
Read More →
Enhance Fleet Performance with High-Efficiency Auxiliary Power Units
Drive sustainable cost savings while increasing driver comfort during short- and long-haul logistics operations.
Read More →
Wabash Trailers Recalled for Improperly Installed Underride Guards
More than 900 Wabash dry van trailers may not comply with the Federal Motor Vehicle Safety Standard for rear impact guards.
Read More →
Why K&B Trucking Is Embracing AI and Driver Safety Technology
Crunching data and embracing artificial intelligence are key in K&B Trucking's safety efforts, says the company's safety director.
Read More →
The Hidden Problem Behind FMCSA's ELD Revocations
NMFTA researchers say dozens of registered ELDs may be built on the same software platforms, allowing compliance and security concerns to persist even after individual devices are removed from the market.
Read More →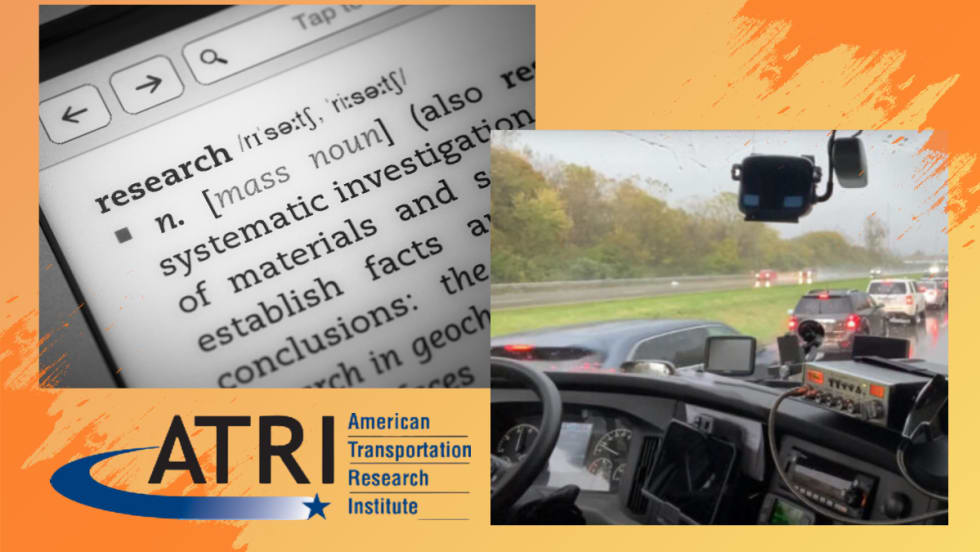
ATRI Wants Motor Carriers for Driver-Facing Camera Study
In this new study, the American Transportation Research Institute will explore how driver-facing cameras can impact safety and operational metrics in trucking fleets.
Read More →