


You also might like:
How Trucking Fleets Can Escape the Insurance Squeeze
ATRI: Lower 2020 Cost Per Mile Reflects Less Spend on Fuel, Driver Benefits
The average cost per mile for motor carriers fell in 2020, as reductions in fuel and driver benefits costs offset rising costs in nearly every other area.
November 23, 2021
The largest single line-item cost continued to be driver wages, representing 34% of operating costs per mile.
Graph: ATRI
8 min to read
The average cost per mile for motor carriers fell in 2020, as reductions in fuel and driver benefits costs offset rising costs in nearly every other area.
That’s according to the American Transportation Research Institute’s 2021 update to An Analysis of the Operational Costs of Trucking. The research is based on detailed 2020 financial data provided by motor carriers of all sectors and fleet sizes.
Overall, the average marginal cost per mile incurred by motor carriers in 2020 dropped by 5 cents per mile, or 3.1%, to $1.64.
Smaller carriers (100 or fewer power units) had a higher cost per mile than large carriers (more than 100 power units), although both sizes saw those costs drop from 2019 to 2020. Total marginal costs were 16.3 cents higher for small fleets than for larger fleets, at $1.74 vs. $1.58, with the largest differences in truck or trailer lease or purchase payments and driver benefits.
Reflection of a pandemic
ATRI pointed out that the survey documented numerous impacts that the COVID-19 pandemic had on trucking and the economy in general.
For instance, the average operating speed of trucks in 2020 was 1.2 mph higher than in 2019. Faster truck speeds were due to low overall traffic levels during pandemic shutdowns, as well as lower fuel costs.
Carriers that were able to capitalize on these faster speeds — by covering more miles — will have generated more revenue but also had relatively higher marginal costs. But mileage was down for many carriers during the pandemic despite faster speeds: 55.4% of ATRI’s repeat respondents reported fewer IFTA miles in 2020 than in 2019.
Other COVID-19 impacts included:
deadhead miles increased to 20.6%
annual operating miles dropped to 89,358 miles per truck
fuel costs declined by nearly 20% to 30.8 cents per mile.
Fuel costs dropped dramatically from 2019 to 2020 – by 13.8%. While fuel remained the second highest line-item, this average decrease of almost 8 cents per mile was a crucial source of overall cost reduction: It allowed carriers to spend more in nearly every other cost center while keeping total per-mile marginal costs lower than in 2018 and 2019, ATRI said.
The drop was caused by substantially lower diesel prices in 2020, which averaged approximately $2.55 per gallon. After remaining relatively stable around $3.00 per gallon for much of 2019, fuel prices dropped rapidly at the start of the COVID-19 pandemic in spring 2020 and reached their lowest point of $2.37 per gallon in November 2020. Prices rebounded during the remainder of 2020 and into 2021, which has seen consistently rising diesel prices so far.
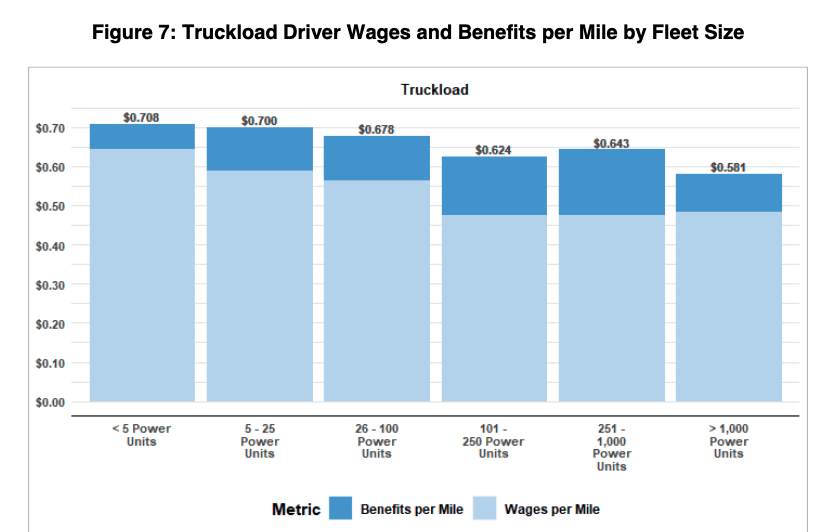
Driver Wages and Benefits
While truck driver wages increased from 2019 to 2020, benefits costs per mile fell. Overall truck driver compensation was 73.7 cents per mile. Due to the decrease in overall marginal costs, however, driver compensation still made up the highest-ever share of the total, at 44%.
Safety and retention bonuses increased by 10.5% and 14.2% respectively, but starting bonuses dropped by 10%, reflecting the soft driver marketplace in early 2020 for many sectors.
For the first time since ATRI began collecting this operational costs data, the average driver wages per mile for small fleets exceeded that for large fleets. Smaller carriers have raised per-mile wages by 24.1% in the past five years, while larger carriers saw a 15.5% change. The average per-mile wage in 2020 was 58 cents per mile for smaller carriers and 56 cents per mile for larger carriers.
Larger carriers, however, spent more on benefits. Truckload carriers with more than 100
power units spent 39% more on benefits per mile than carriers with 100 or fewer. Much of this difference, however, comes from fleets with fewer than five power units, meaning that many fleets of 5 to 100 power units offer benefits more comparable to large fleets, ATRI concluded.
Benefits offered to drivers varied. According to the American Trucking Associations’ latest Driver Compensation report (based on pre-COVID-19 data), 95% of carriers offered health insurance while 92 percent of carriers offered paid leave. ATRI’s survey mirrored those findings, at 93% and 92% offering paid leave. Despite the decline in ATRI’s benefits cost per mile from 2019 to 2020, all benefit types were more commonly offered in 2020 than in 2019.
Approximately 15.5% of the drivers used by ATRI respondents were contracted
owner-operators — a percentage that’s twice as high as it was two years prior, in 2018. They also paid owner-operators more, with an average per-mile owner-operator pay of $1.65 per mile, compared to only 99 cents in 2018. That 2018 number, however, was down significantly; in 2015, the average was $1.52.
Safety bonuses increased 10.5% on average from 2019 to 2020. The average safety bonus amount for 2021, at $1,597, is the highest in the last three years.
Average retention bonuses increased by 14.2% from 2019 to 2020, while sign-on bonuses fell by 10%.
Truck Insurance Costs Hit New High
Insurance costs continued their climb, rising more than 18% to 8.7 cents per mile in 2020 — the highest in the history of the report.
Recent ATRI research has shown that nuclear verdicts in the trucking industry are increasing dramatically over time and that the accumulation of smaller verdicts can be equally costly. Insurance premiums continue to go up for carriers of all sectors, fleet sizes, and locations, despite the fact that most carriers are increasing liability exposure by raising deductibles and lowering excess coverage levels.
Insurance premium costs per mile remain almost twice as high for smaller carriers at, 12.2 cents per mile, versus larger carriers at 6.8 cents, and the insurance cost disparity between large and smaller carriers increased slightly from 2019.
ATRI noted that large fleets have access to more risk management strategies than small fleets. These strategies include insurance captives and Self-Insurance Retentions (SIRs), which ATRI’s forthcoming “The Impacts of Rising Insurance Costs on the Trucking Industry” report suggests may be growing in response to high insurance premiums.
Insurance industry experts interviewed by ATRI expressed cautious hope that rate increases might moderate over the coming year. These hopes stem in part from the fact that positive changes continue, albeit gradually, in the field of tort reform.
Trend Toward Shorter Hauls Continues
For-hire carriers continue to shorten trip lengths, according to the ATRI survey. The majority of trips for the majority of carriers (69%) in 2020 were less than 500 miles. All other trip lengths declined in frequency for a majority of carriers.
In the last five years, trips over 1,000 miles have dropped, from 16% of respondents in 2016 to 12% in 2020. Regional trips between 100 and 500 miles remain the most common, but even this category represents a declining share of most carriers’ trips, dropping from 40% in 2016 to 37% in 2020.
While the COVID-19 pandemic may have contributed to declining trip lengths, ATRI noted in its report, it did not significantly change the ongoing trend. If the current pace of change persists, local trips will become the primary trip length for a majority of carriers by 2022.
Driving these trends, ATRI said, are the rise of e-commerce and an emerging preference among drivers for shorter hauls.
Trends in trip length varied by fleet size, however. Fleets with 5 to 100 power units had more local trips on average – 43% of their total trips – compared to fleets with more than 100 power units, among which only 23% of total trips were local. This divergence in average trip length may reflect smaller fleets’ market strategies for avoiding head-to-head competition with larger fleets, ATRI said.
Private fleets generally experienced the same trends in trip length. In the National Private Truck Council benchmarking report, average private truck trip lengths declined 31 miles to 194 miles in 2020, the fourth consecutive annual decrease in trip lengths for private fleets.
Equipment: More Expensive, Older
Truck and trailer lease or purchase payments increased to an all-time high of 27.1 cents per mile – over 40% higher than 10 years ago.
ATRI’s average truck-tractor trade cycle in 2020 was 8.7 years or 669,903 miles, both an increase from the 2019 averages of 6.8 years or 585,294 miles. The average trade cycle for trailers was 12.3 years, but responses varied widely based on the type of trailer and size of fleet. The trade cycle for trailers has shortened since 2018, when the average number of years before replacement was 13.3.
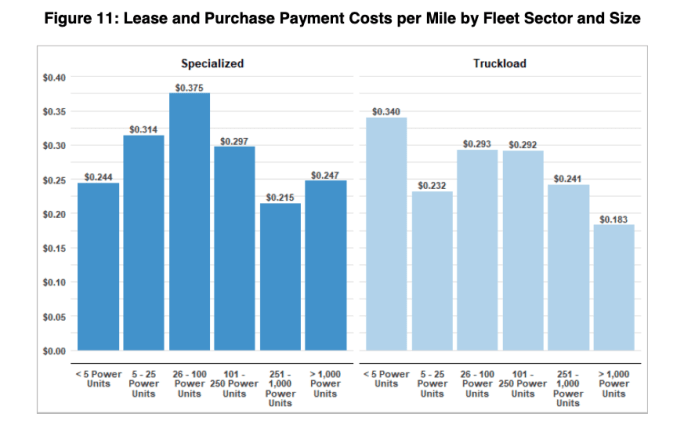
Total marginal costs were 16.3 cents higher for small fleets than for larger fleets, with the largest differences in truck or trailer lease or purchase payments and driver benefits.
Graph: ATRI
The number of trailers per truck among carriers also increased to 2.9 in 2020 after several years in the 2.7 range. An increase in the trailer-to-truck ratio may have resulted from either the limited availability of new trucks or increased trailer purchases, or both.
An increase in trailers per truck could be driven by the need for greater logistical flexibility within the industry as carriers attempt to mitigate the impact of detention and driver shortages with increased trailer capacity. The for-hire trailer-to-truck ratio is still smaller than the private-fleet ratio of 3.3.
The percentage of survey respondents running at least one truck on some form of alternative fuel dropped, from 15% in 2019 to 10% in 2020. The percentage of trucks being run on alternative fuels is much lower. Only 0.4% of all trucks operated by ATRI respondents use any kind of alternative fuel, a figure that has remained consistent over the past five years, ATRI said.
Compressed natural gas (CNG) continued to have the highest adoption among the surveyed carriers in 2020, but at a lower proportion than in 2019, with 6.1% of carriers having at least one truck using CNG. The second highest alternative fuel type was battery electric power, with 3.8% of the responding reporting at least one battery-powered truck in their fleet. Liquefied natural gas (LNG) usage fell from 5% in 2019 to 2.3% of carriers in 2020.
For access to the full report, visit ATRI’s website.
More Fleet Management
How Innovative Trucking Leaders Turn Change Into an Advantage
As the pace of change accelerates in trucking, the fleets that adapt best have more than the latest technology. They have cultures that embrace improvement.
Read More →
Freight Broker Bonds Just Got Harder to Get. Here's What That Means for Your Fleet.
When it gets harder for a freight broker to prove they are financially sound, the ones who cannot clear that bar get pushed out of the market. And those are exactly the brokers who used to leave motor carriers holding the bag.
Read More →
Long-Awaited Canadian Border Bridge to Open in Detroit
For trucking, the bridge opening should offer immediate improvements in efficiency and reliability, with new customs facilities, expanded inspection capacity, and direct freeway-to-freeway connections.
Read More →
Aurora Rolls Out Next Generation of Driverless Trucks for Commercial Freight
Aurora's latest autonomous trucks it's rolling out with International feature lower-cost hardware designed for a million miles as the company expands commercial driverless freight operations across the U.S. Sun Belt.
Read More →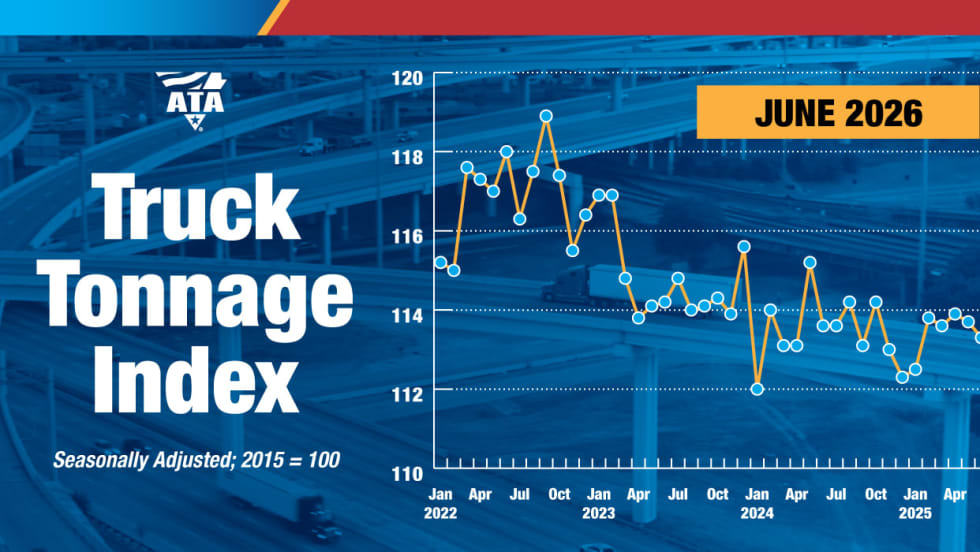
Freight Tonnage Down, Rates up, as Lower Capacity Powers Trucking Recovery
The recovery from the freight recession continues to be driven by reduction in capacity rather than by increased demand.
Read More →
Think Your Trucking Fleet Isn't Using Much AI? Think Again
Shadow AI — the use of unauthorized artificial intelligence tools at work — is becoming increasingly common, putting sensitive company data at risk. Learn how trucking fleets can protect sensitive data while embracing AI.
Read More →
ArcBest Consolidates Brands, Cuts Workforce
The company will bring three business units under the ArcBest brand, eliminate about 2% of positions, and expects the changes to generate $40 million in annual savings.
Read More →
Trucking Fleets Faced Record Operating Costs During Third Year of Freight Recession
ATRI's annual operational cost report shows carriers trimmed fleets, delayed equipment purchases, and ran older trucks as expenses continued to outpace freight rates.
Read More →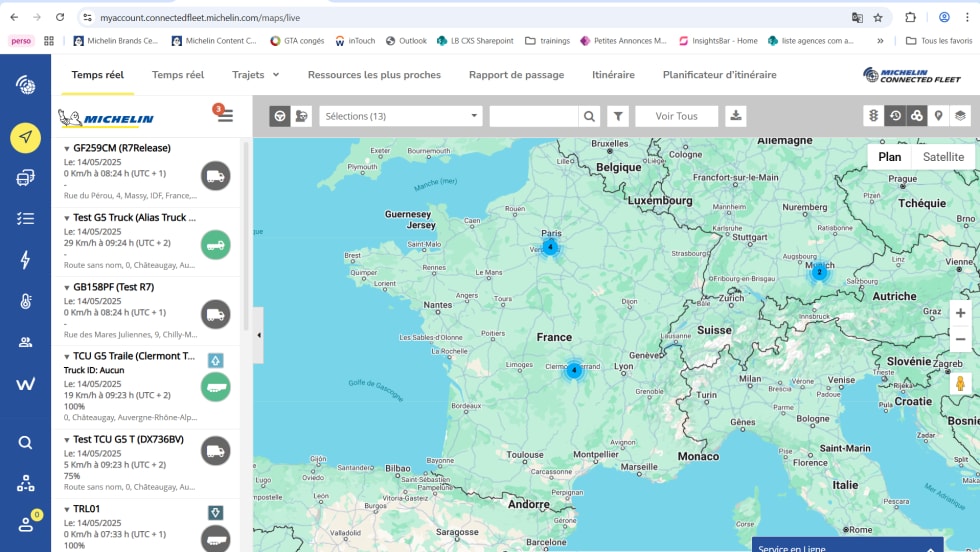
Michelin Adds AI Assistant to MyConnectedFleet Platform
Michelin’s new generative AI tool delivers instant fleet insights, helping managers analyze fuel use, tire maintenance, vehicle status, and operational performance without manually creating reports.
Read More →
LytxOne Platform Now Features AI, Compliance, and Asset Tracking Tools
New enhancements add AI-powered insights, asset tracking, compliance automation, and configurable privacy controls to Lytx's all-in-one fleet management platform.
Read More →