

Driver Safety Behavior Insights Gleaned from Lytx Data
Could drivers be more drowsy on Tuesday mornings because of Monday Night Football? And what does wearing a seat belt have to do with the likelihood of having a crash? Those are among the insights Lytx shared at the American Trucking Associations’ Management Conference and Exhibition.

Could drivers be more drowsy on Tuesdays because of Monday Night Football? And what does wearing a seatbelt have to do with the likelihood of having a crash? Those are among the insights Lytx shared with reporters during a briefing at the American Trucking Associations’ Management Conference and Exhibition in Austin, Texas, in late October.
In its State of the Data presentation, Lytx offered insights based on 100 billion miles of driving data, focusing on over-the-road truck-driving safety, risk factors and behaviors. Lytx is a provider of video telematics, analytics and safety solutions; you might know them better by the DriveCam name of their in-cab camera safety and coaching offering.
The insights come from analyzing the data in Lytx's trucking-industry client database. The data is anonymized, normalized and generalizable to the trucking industry as a whole. (For ATA, this focused on over-the-road fleets, not vocational fleets, delivery fleets, etc.)
Riskiest Days and Times
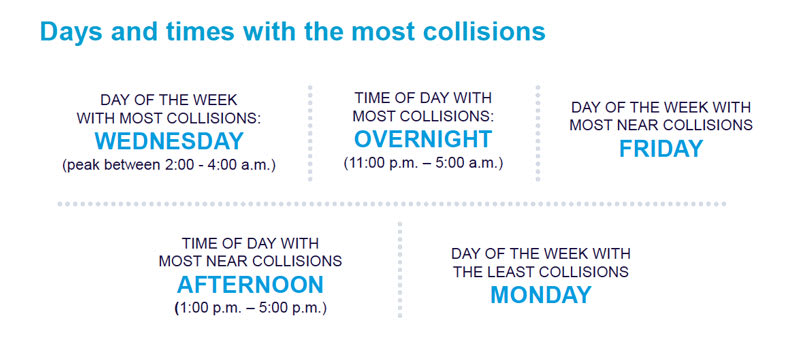
Lytx trucking-industry data shows the top riskiest days of the week and times of day for North American truck drivers between January and September 2018 were:
Day of the week with most collisions: Wednesday (peak between 2:00 – 4:00 a.m.)
Time of day with most collisions: Overnight (11:00 p.m. – 5:00 a.m.)
Day of week with most near collisions: Friday
Time of day with most near collisions: Afternoon (1:00 p.m. –5:00 p.m.)
Day of week with least collisions: Monday
Generally speaking, the risk tends to rise steadily as the work week progresses, said Ryan Brandos, a Lytx data analyst, who presented the findings at ATA MC&E.
“There is a distinct difference between collision and near-collision trends," he explained. “Collisions occur more frequently at night. We see those same drivers avoid contact during the afternoon hours, resulting in more near collisions during the day.”
Common Risky Behaviors
Looking at 358,359 fewer instances of risky driving between June-August 2018 compared to the same period in 2017, Lytx reported the top 10 observed driving behaviors by frequency, along with their relative, correlative collision risk.
Correlative Collision Risk refers to the relationship or connection between the observed driving behavior and a collision. For instance, we see that “driver not wearing seatbelt,” the most observed behavior, with a correlative collision rank of 4, is more closely related to a collision than smoking, which while the fourth most common observed behavior, had a rank of 35.
Brandos said it might seem odd that not wearing a seatbelt is so correlative. However, he said, “If the driver was willing to take a chance on their personal safety, they’re probably more likely to take a chance with their vehicle safety.”
The second most commonly observed driving behavior was “late response,” which is ranked fifth.
Most of these behaviors were declining in frequency from 2017 to 2018, with the exceptions being following distance of 1 to 2 seconds, posted speed violations, and “other” violations such as traveling over the centerline, blocking traffic in an intersection or driving on the shoulder.
"The driving behavioral improvements we're seeing are largely the result of our clients' strong focus on driver coaching and training," said Del Lisk, vice president of safety services at Lytx, in a release.

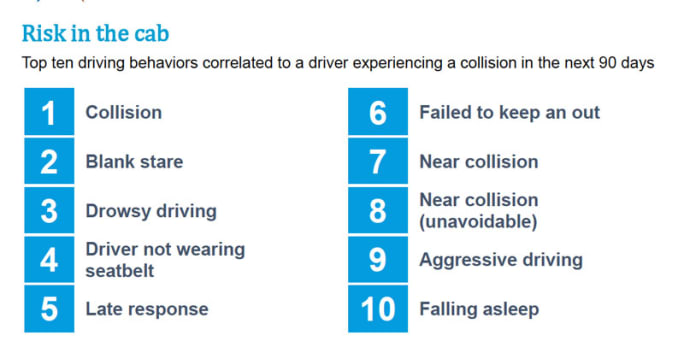
Most Dangerous Behaviors
Using human-reviewed data, Lytx said, it is able to identify correlations between specific risky driving behaviors and the likelihood of those behaviors resulting in a collision. The top 10 driving behaviors it found were correlated to a driver experiencing a collision in the next 90 days were:
Collision (if a driver has a crash, he or she is more likely to have another in the near future.)
Blank stare
Drowsy driving
Driver not wearing seatbelt
Late response
Failed to keep an out (the driver didn’t leave enough space to react to other drivers’ behavior)
Near collision
Near collision (unavoidable)
Aggressive driving
Falling asleep
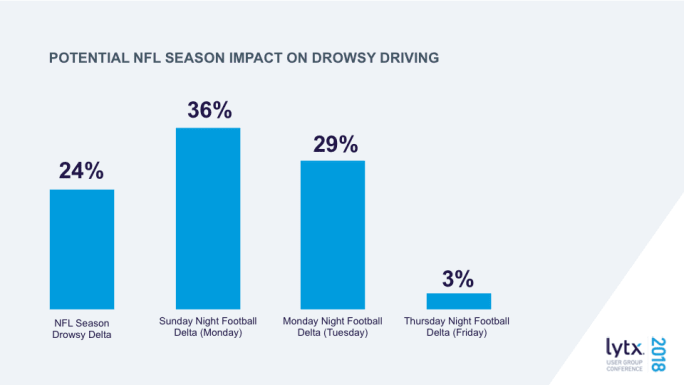
Now About That Monday Night Football…
Brandos initially discovered an odd statistic while doing research into seasonality trends in a subsection of the solid waste segment – nearly a triple increase in captured drowsy driving events during a four-month time frame every year for several years in a row, from late August to mid-December – and the bulk of this spike was on Mondays and Tuesdays, in the early mornings.
“This led me to believe there was something that was very widespread and occurring on Sunday/Monday evening” that was affecting the data, Brandos explained to HDT, and the effect was more concentrated in the Eastern and Central time zones. His theory? Sunday and Monday Night NFL football games that can run as late as 1 a.m. eastern time.
He later looked at all Lytx customer vehicles and found a less-pronounced, but similar, increase in captured drowsy driving events.
Turns out, on Mondays following an NFL season game, there's a 36% spike in drowsy driving events compared to Mondays when there are no games the previous night. On Tuesdays after a game, the increase in drowsy driving is 29%. But on Fridays, when NFL games are only broadcast to a much smaller audience in a special paid channel, there's a much smaller increase. Overall, there's a 24% increase in drowsy driving associated with NFL season games.
More Safety & Compliance

Brake Safety Week to Focus on Drums and Rotors
Commercial vehicle inspectors will be focusing on brakes during CVSA's Brake Safety Week, August 23-29.
Read More →
Trump Administration Looks to Put More Veterans Behind the Wheel
The Freedom Haulers program pulls together existing and expanded programs at several federal agencies to recruit veterans to drive commercial heavy-duty trucks and cut the red tape for them to get a CDL, training, and employment.
Read More →
$604 Million Verdict Tests Broker Liability After Supreme Court Ruling
C.H. Robinson plans to appeal after a Texas jury found it bore the largest share of responsibility for a fatal 2021 crash, in a case that follows the Supreme Court's Montgomery decision allowing negligent hiring claims against freight brokers.
Read More →
How Fraley & Schilling Improved Logbook Compliance by Over 50%
Fraley & Schilling needed a way to close a compliance workflow gap in its ELD system without adding more work from driver training, reminders, and back-office follow-ups. It found the answer in a custom driver app.
Read More →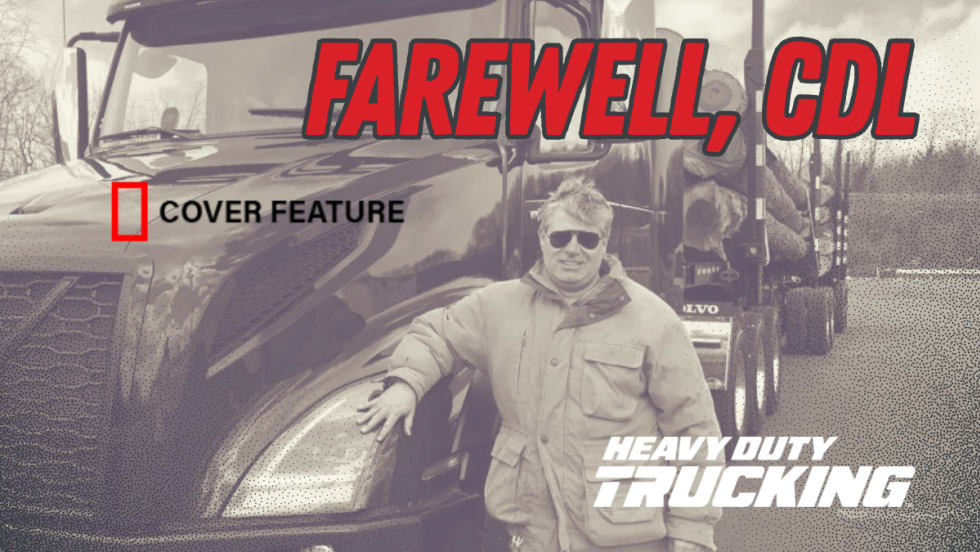
Farewell, CDL: Why I'm Giving Up My Commercial Driver's License
After more than 20 years as a CDL holder, HDT Executive Editor Jack Roberts is letting his commercial license expire. Not because he wants to — but because trucking's nuclear verdict crisis has made the risks of public-road test drives too great for editors, manufacturers, and everyone involved.
Read More →
Enhance Fleet Performance with High-Efficiency Auxiliary Power Units
Drive sustainable cost savings while increasing driver comfort during short- and long-haul logistics operations.
Read More →
Wabash Trailers Recalled for Improperly Installed Underride Guards
More than 900 Wabash dry van trailers may not comply with the Federal Motor Vehicle Safety Standard for rear impact guards.
Read More →
Why K&B Trucking Is Embracing AI and Driver Safety Technology
Crunching data and embracing artificial intelligence are key in K&B Trucking's safety efforts, says the company's safety director.
Read More →
The Hidden Problem Behind FMCSA's ELD Revocations
NMFTA researchers say dozens of registered ELDs may be built on the same software platforms, allowing compliance and security concerns to persist even after individual devices are removed from the market.
Read More →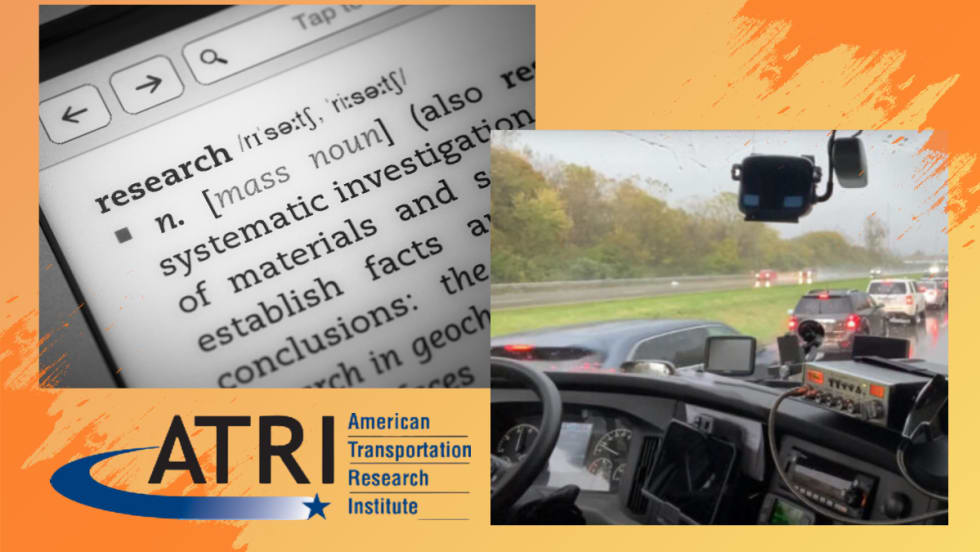
ATRI Wants Motor Carriers for Driver-Facing Camera Study
In this new study, the American Transportation Research Institute will explore how driver-facing cameras can impact safety and operational metrics in trucking fleets.
Read More →