

DAT: February Truckload Rates Jump
Truckload freight pricing rose and national average load-to-truck ratios for dry van and refrigerated freight hit record highs in February.

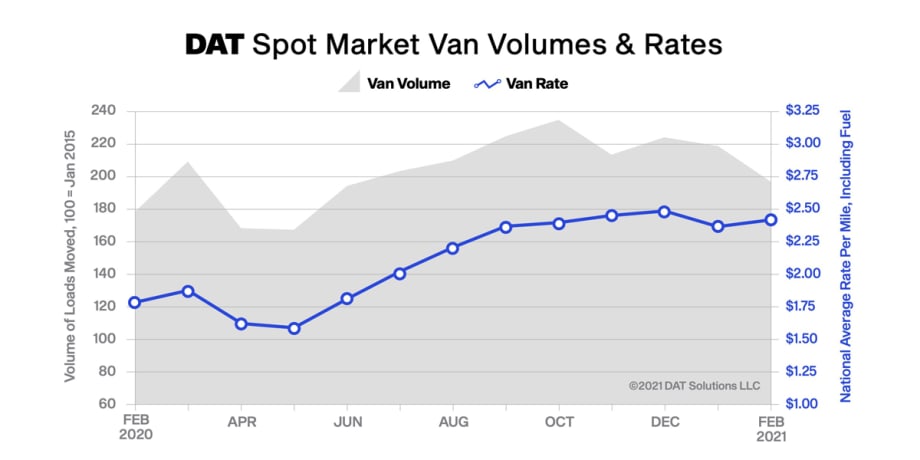
Dry van spot rates averaged $2.41 per mile in February, up from $2.36 in January and 63 cents higher than in February 2020.
Graph: DAT
Truckload freight pricing rose and national average load-to-truck ratios for dry van and refrigerated freight hit record highs in February as severe weather across much of the United States distressed supply chains and disrupted transit times.
The DAT Truckload Volume Index, a measure of dry van, refrigerated and flatbed loads moved by truckload carriers, declined 9.8% from January to February, reflecting a reduction in freight movement for the month.
However, demand for truckload capacity tightened as contracted carriers struggled to fulfill service commitments, DAT officials said in a press release. During the week of Feb. 21, DAT achieved record network volumes with more than 10 million loads posted, an increase of 42% from the previous high recorded in June 2018 and a 174% improvement over the same period in February 2020.
Nationally, the van load-to-truck ratio averaged 7.5 in February compared to 4.3 the previous month, and the reefer ratio was 15.9, up from 8.2 in January. The flatbed ratio jumped from 47.9 in January to 62.2 last month.
The impact on truckload pricing was significant. Dry van spot rates averaged $2.41 per mile in February, up from $2.36 in January and 63 cents higher than in February 2020. Increases were even greater in the temperature-controlled sector, where reefers were in demand to keep traditional dry freight from freezing. Reefer spot rates averaged $2.70 a mile, up 9 cents month over month and 62 cents year over year.
“The scope of the weather system and impact on people and infrastructure at once constricted freight volumes and made it more expensive to move goods long distances over the road,” said Ken Adamo, Chief of Analytics at DAT. “After a decline in January and early February, pricing unexpectedly shot back up to post-holiday levels and strained fragile supply chains.”
In addition to record-level spot market volumes, intermodal network disruptions pushed more freight into the spot markets as shippers sought to meet delivery deadlines with customers.
At $2.58 per mile, the national average spot flatbed rate hit its highest point since August 2018 as the movement of building products and raw materials for manufacturing increased. The flatbed load-to-truck ratio was 62.2 compared 47.9 in January and 20.4 in February 2020.
Load-to-truck ratios reflect the number of available loads on the DAT network of load boards relative to the number of available trucks and indicate levels of supply and demand in the truckload marketplace.
DAT anticipates spot rates and truckload freight volumes in March to fall from record highs, but remain elevated as they track a more normal pattern of activity.
Demand for refrigerated trailers will continue to build as shippers move domestic and imported produce, and flatbed carriers will continue to benefit from the high demand for farm and construction machinery.
More Equipment
Enhance Fleet Performance with High-Efficiency Auxiliary Power Units
Drive sustainable cost savings while increasing driver comfort during short- and long-haul logistics operations.
Read More →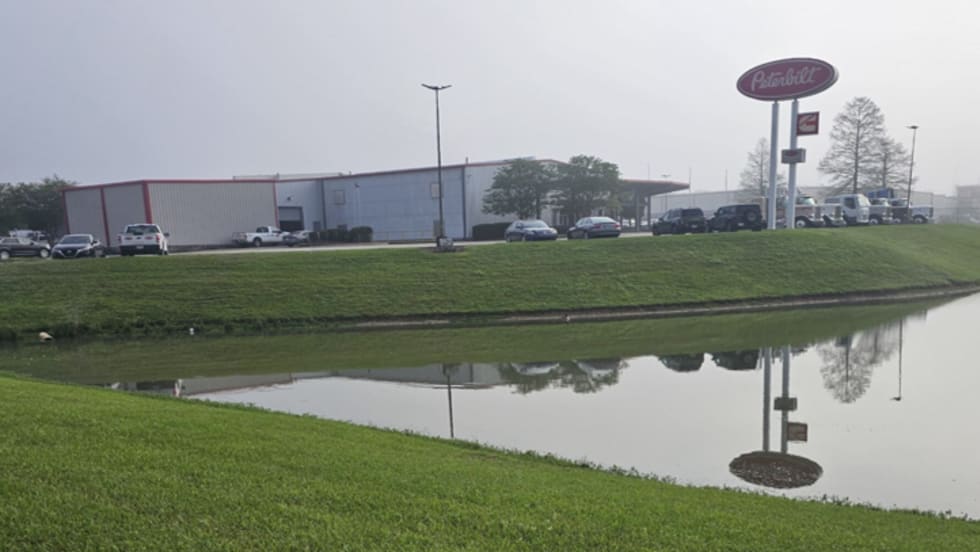
Rush Expands Gulf Coast Peterbilt Network With Louisiana Acquisition
The expanded Rush network gives fleets additional sales, service, leasing and collision repair support across Louisiana's major trucking markets.
Read More →
Photos: Shell SuperRigs Light Up Bristol Tennessee
Kenny Ziglar II of Rawlins, Wyo., captured Best of Show honors for the second consecutive year with his 2007 Peterbilt 379, nicknamed “Scrapin By,” at the 44th Annual Shell Rotella SuperRigs competition held June 25-27 at Bristol Motor Speedway in Bristol, Tenn.
Read More →
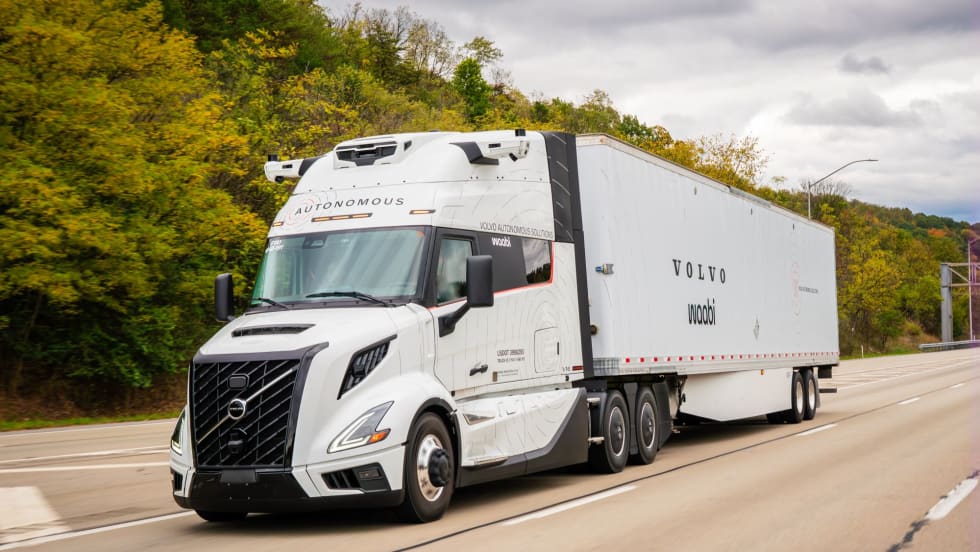
Waabi, Volvo Claim Breakthrough in Scaling Autonomous Trucking
Waabi says its AI-powered virtual driver successfully transferred to Volvo Autonomous Solutions' Volvo VNL Autonomous platform without retraining or additional data, a milestone the companies say could dramatically accelerate commercialization of autonomous trucks.
Read More →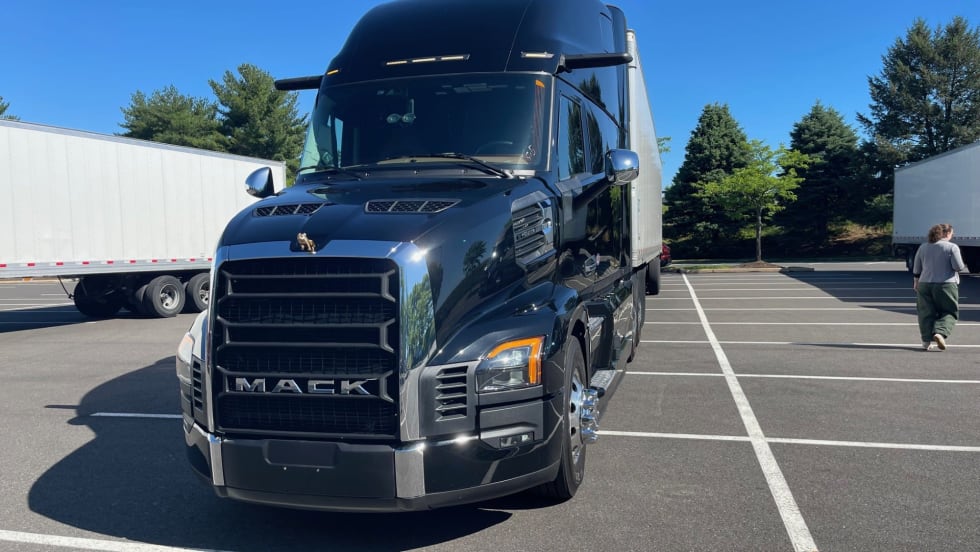
Why the Mack Pioneer Signals a New Era in Class 8 Truck Design
After a public-road drive through eastern Pennsylvania, one thing became clear: Mack's new Pioneer isn't simply packed with technology -- it's been engineered around the driver in ways that could redefine long-haul trucking.
Read More →
Mack Defense Secures $47 Million to Continue Military Dump Truck Production
President Trump visited Mack Defense’s Macungie, Pennsylvania, facility on June 23 to tout a $47 million Heavy Dump Truck order.
Read More →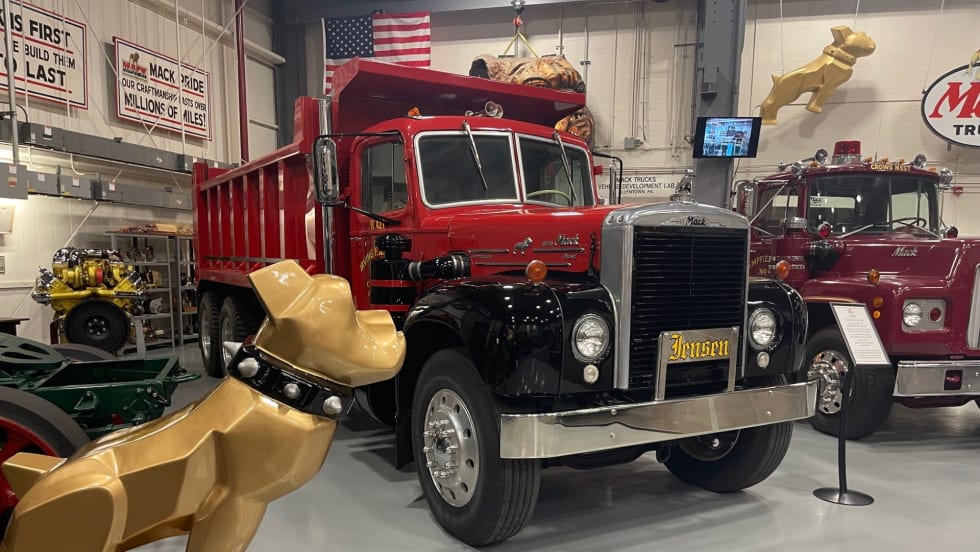
New (Antique) Trucks Take the Spotlight at the Mack Trucks Museum
The Mack Trucks Historical Museum has a slate of new historic vehicles on display this year.
Read More →
WEX, TFS Launch Equipment Financing Program for Trucking Fleets
The companies say the program uses technology to connect fleets with financing providers more efficiently than traditional lending channels.
Read More →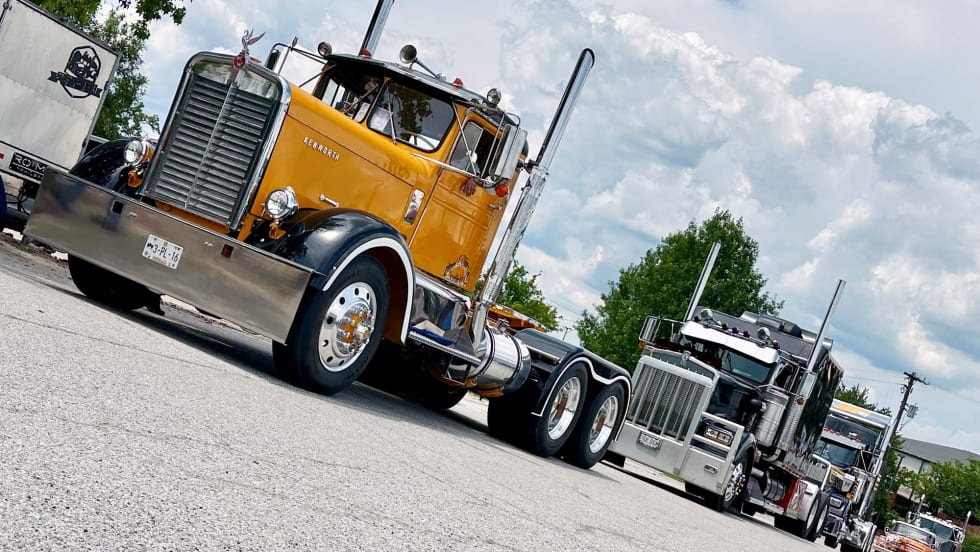
Historic, Vintage, and Antique Trucks at the 2026 ATHS Convention
More than 500 trucks were on display, indoors and out, at the 2026 American Historical Society annual convention in Springfield, Missouri.
Read More →
DTNA Software Update Gives Truckers More Time Before DEF Derates Take Effect
The changes reflect EPA guidance aimed at reducing downtime caused by emissions-system faults while maintaining compliance requirements.
Read More →