


FTR: 2021 Freight Volume, Rates Look Strong, but Risks Remain
Trucking Conditions in October Highest Ever Measured
FTR is reporting that its Trucking Conditions Index for October 2020 literally went off the charts to the highest reading the research firm has ever recorded.
December 18, 2020

FTR’s Trucking Conditions Index for October jumped to the highest level in the nearly 30 years captured in the data to a 16.17 reading
Photo: Mack Trucks
2 min to read
Want some good news for a change? Well, how about this: FTR’s Trucking Conditions Index for October jumped to the highest level in the nearly 30 years captured in the data to a 16.17 reading. This record comes just six months after the lowest TCI reading ever recorded (-28.66 in April) during the initial phases of the pandemic.
October’s extraordinary market conditions resulted from a sharp increase in capacity utilization, a robust rate environment, and improving freight demand. While October might prove to be the peak in this cycle, FTR forecasts positive TCI readings at least through 2021.
“The big swing in the economy during the pandemic naturally produced a big swing for the trucking industry," said Avery Vise, FTR vice president of trucking. "Government stimulus, pressure resulting from extraordinarily lean inventories, and a shift in consumer spending toward goods instead of services have combined to restore a huge chunk of the freight demand lost this spring.
"Meanwhile, both typical and extraordinary stresses on the supply of drivers has driven up capacity utilization and fueled higher rates. Freight demand growth should moderate to a more sustainable level, but constraints on driver capacity will be hard to overcome until COVID-19 vaccines are widely available. The result should be a healthy environment for trucking, even if freight demand were to prove a bit weaker than we are forecasting.”

It's been a year of highs and lows for FTR's Trucking Conditions Index.
Graph: FTR
The TCI tracks the changes representing five major conditions in the U.S. truck market. These conditions are: freight volumes, freight rates, fleet capacity, fuel price, and financing. The individual metrics are combined into a single index indicating the industry’s overall health. A positive score represents good, optimistic conditions while a negative score represents bad, pessimistic conditions. Readings near zero are consistent with a neutral operating environment, and double-digit readings in either direction suggest significant operating changes are likely.
More Fleet Management
How Innovative Trucking Leaders Turn Change Into an Advantage
As the pace of change accelerates in trucking, the fleets that adapt best have more than the latest technology. They have cultures that embrace improvement.
Read More →
Freight Broker Bonds Just Got Harder to Get. Here's What That Means for Your Fleet.
When it gets harder for a freight broker to prove they are financially sound, the ones who cannot clear that bar get pushed out of the market. And those are exactly the brokers who used to leave motor carriers holding the bag.
Read More →
Long-Awaited Canadian Border Bridge to Open in Detroit
For trucking, the bridge opening should offer immediate improvements in efficiency and reliability, with new customs facilities, expanded inspection capacity, and direct freeway-to-freeway connections.
Read More →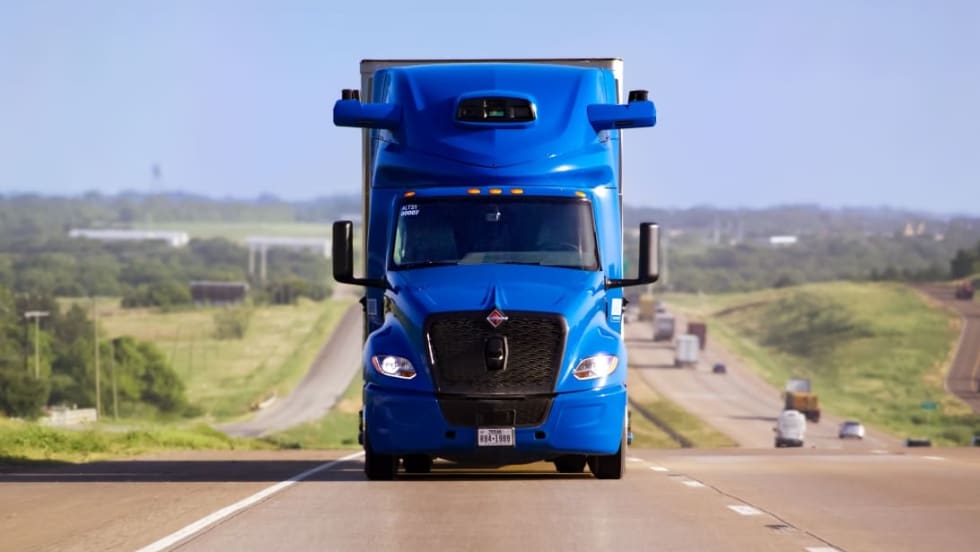
Aurora Rolls Out Next Generation of Driverless Trucks for Commercial Freight
Aurora's latest autonomous trucks it's rolling out with International feature lower-cost hardware designed for a million miles as the company expands commercial driverless freight operations across the U.S. Sun Belt.
Read More →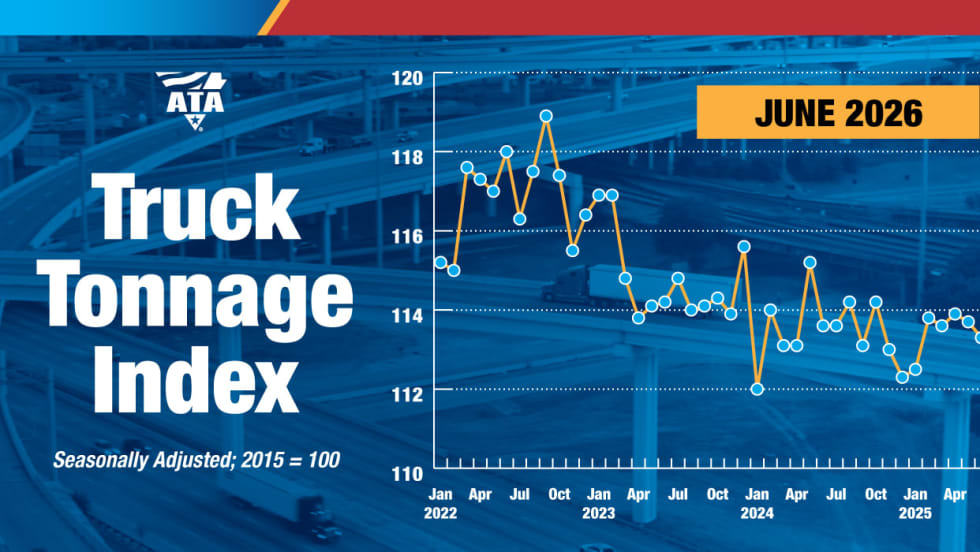
Freight Tonnage Down, Rates up, as Lower Capacity Powers Trucking Recovery
The recovery from the freight recession continues to be driven by reduction in capacity rather than by increased demand.
Read More →
Think Your Trucking Fleet Isn't Using Much AI? Think Again
Shadow AI — the use of unauthorized artificial intelligence tools at work — is becoming increasingly common, putting sensitive company data at risk. Learn how trucking fleets can protect sensitive data while embracing AI.
Read More →
ArcBest Consolidates Brands, Cuts Workforce
The company will bring three business units under the ArcBest brand, eliminate about 2% of positions, and expects the changes to generate $40 million in annual savings.
Read More →
Trucking Fleets Faced Record Operating Costs During Third Year of Freight Recession
ATRI's annual operational cost report shows carriers trimmed fleets, delayed equipment purchases, and ran older trucks as expenses continued to outpace freight rates.
Read More →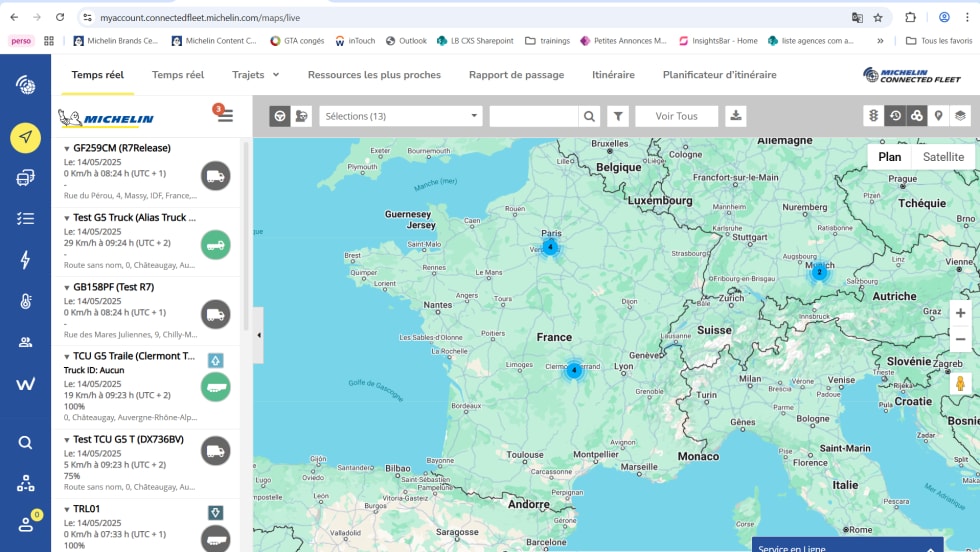
Michelin Adds AI Assistant to MyConnectedFleet Platform
Michelin’s new generative AI tool delivers instant fleet insights, helping managers analyze fuel use, tire maintenance, vehicle status, and operational performance without manually creating reports.
Read More →
LytxOne Platform Now Features AI, Compliance, and Asset Tracking Tools
New enhancements add AI-powered insights, asset tracking, compliance automation, and configurable privacy controls to Lytx's all-in-one fleet management platform.
Read More →