

U.S. Spot Freight Availability Declines, Canadian Market Bounces Back
UPDATED -- U.S. spot-market load availability fell 5.6% during the week ending Feb. 6, with the number of van and refrigerated loads dropping 17% and 12%, respectively, according to DAT Solutions and its network of load boards.


UPDATED -- U.S. spot-market load availability fell 5.6% during the week ending Feb. 6, with the number of van and refrigerated loads dropping 17% and 12%, respectively, according to DAT Solutions and its network of load boards.
The combination of fewer posted loads and 2.5% more capacity helped hold rates down compared to the previous week. Declining fuel prices also played a role: diesel prices fell 3 cents to a national average of just under $2.01 per gallon, an 11-year low.
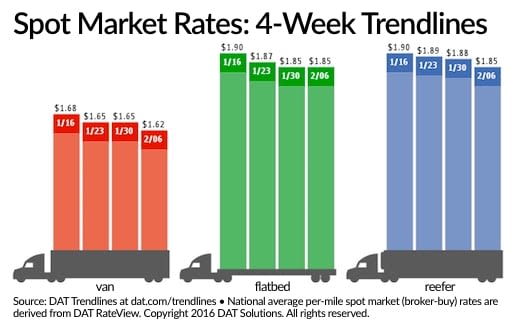
The national average van rate edged down 3 cents from the week before to $1.62 per mile, while the reefer rate fell 3 cents to $1.85 per mile, both the lowest in at least the last four weeks.
The decline for vans included a 1-cent drop in the average fuel surcharge. Rates rose on high-volume lanes originating in Denver, Houston, and Atlanta, but outbound rates declined in Chicago and Philadelphia.
There was also a 1-cent drop in the reefer fuel surcharge with rates ranging from an average of $2.52 per mile out of Green Bay to $1.40 per mile from Lakeland, Fla.
The average flatbed rate was unchanged at $1.85 per mile compared to the previous week and compares to $1.90 in mid-January. Rates varied from $2.83 per mile outbound from Harrisburg, Penn to as low as $1.48 per mile out of Phoenix.
Van load posts declined 14% while available capacity increased 4%, which sent the van load-to-truck ratio down 17%, resulting in 1.4 van loads for every van posted on the DAT network. In the reefer market, there were 11% fewer loads while truck posts added 1%. The load-to-truck ratio declined 12% from 3.8 to 3.4 loads per truck.
The spot flatbed freight market found a little footing with load volume up 6% against a 1% increase in capacity. That yielded a 6% increase in the flatbed load-to-truck ratio, from 8.3 to 8.7 loads per truck. Changes in the ratio often signal impending changes in rates, according to DAT.
Canadian Spot Market Up For A Change
On the heels of declining load volumes for four consecutive months, TransCore Link Logistics load volumes for Canadian and cross-border loads picked up in January.
Month-over-month volumes were 12% above December. In spite of this, compared to the same month last year, load volumes were down 28% from January 2015.
The freight index has shown alternate highs and lows for the month of January for the past three years. Compared to December of the prior year, January 2016 was above December 2015 but January 2015 was below December 2014, a year of record-breaking highs, and January 2014 was above December 2013.
Cross border spot market loads leaving Canada were lower by 18%, and loads coming into Canada decreased 33%year-over-year. These volumes averaged 72% of the total data submitted by Loadlink’s Canadian-based customers.
Intra-Canada load volumes represented 23% of the total volumes and were lower by 25 percent year-over-year.
Posted equipment last month was below what was posted in December 2015, tightening the capacity by 5% month-over-month. However, these postings were above January 2015 by 28%. The equipment-to-load ratio narrowed to 3.18 last month from 3.73 in December 2015. Year-over-year, this ratio increased from 1.79 in January 2015, representing a 78% change.
TransCore’s Canadian Freight Index measures the movement of freight and equipment from roughly 5,500 of Canada’s trucking companies and freight brokers, and includes all domestic Canadian, cross-border and interstate data submitted by Loadlink’s customers.
Update adds Canadian spot freight report.
More Fleet Management

What Geotab's New AI Connector Means for Fleets
Fleets can now ask their usual AI assistants questions about maintenance, safety, fuel use, and vehicle performance, using their live Geotab data, and take action on the answers without leaving their preferred AI tool.
Read More →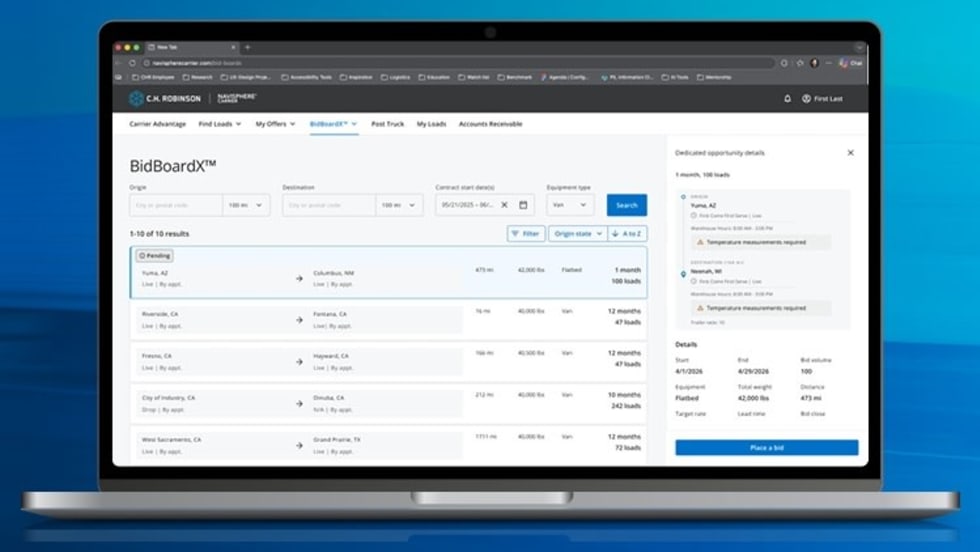
New C.H. Robinson Tool Opens Door to More Predictable Freight
BidBoardX lets carriers search, bid on, and secure committed freight opportunities through a single digital marketplace.
Read More →
New York City's Microhub Project is Delivering Results
Trucking, last-mile delivery companies, and environmental advocates like what they are seeing so far with New York's microhub program.
Read More →

Why Truck Detention Keeps Costing Fleets Time and Money
A 2024 ATRI study found detention affects nearly 40% of truckload stops and costs the industry more than $15 billion annually. Despite the toll on drivers, fleets, and supply chains, the problem remains stubbornly persistent.
Read More →
Time is Running Out to Apply for Exclusive HDT Event
Heavy Duty Trucking Exchange brings fleet managers and suppliers together for the deeper conversations that lead to ideas, partnerships, and solutions. Time is running out to apply for the September event.
Read More →
Amazon Launches Less-Than-Truckload Freight Offering for All Businesses
This launch is the latest addition to Amazon Supply Chain Services, a portfolio of supply chain capabilities from Amazon, including freight, distribution, fulfillment, and parcel shipping.
Read More →
Import Cargo Volume to See Year-Over-Year Gain Again in June, Then Remain Below 2025 Levels Into Fall
After July, the report predicts a weakening in import volume as consumer uncertainty remains high and the impact of increasing inflation takes its toll.
Read More →
AUCTION OF EQUITY INTEREST IN HEAVY HAUL TRUCKING COMPANY!!
Mark your calendar: June 30, 2026 (10:00 a.m. PDT). A 37.5% ownership interest in MagnaTrans, LLC, a California limited liability company doing business as Magna Transportation Group, will be sold in an in-person and online auction to the highest bidder or bidders under Article 9 of the Uniform Commercial Code. The Rancho Cucamonga-based heavy haul and over-dimensional trucking company operates across California, Oregon, and Arizona.
Read More →
Volvo Trucks Adds Unattended Over-the-Air Software Update Capabilities
The latest evolution of Volvo’s over-the-air update technology allows software updates to run while trucks are parked, helping fleets keep vehicles current without disrupting operations.
Read More →
How Waste Connections is Using Data, Telematics, and AI
How do you manage and maintain more than 18,000 connected trucks? Data. Lots of it.
Read More →