

Inrix: Traffic Congestion Drops 30%
The U.S. experienced a 30% drop in traffic congestion in 2011, according to Inrix's annual Traffic Scorecard. Seventy of America's top 100 most populated cities showed decreases in traffic last year as well
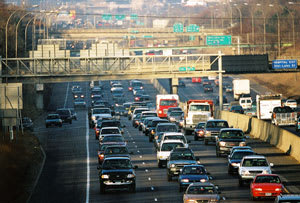
The U.S. experienced a 30% drop in traffic congestion in 2011, according to Inrix's annual Traffic Scorecard. Seventy of America's top 100 most populated cities showed decreases in traffic last year as well.
These results are indicative of a "stop-and-go" economy, where lack of employment combined with high fuel prices is keeping Americans off the roads, according to Inrix, which provides traffic information, directions and driver services.
"The declines in traffic congestion across the U.S. and Europe are indicative of stalled economies worldwide," says Bryan Mistele, Inrix president and chief executive officer. "In America, the economic recovery on Wall Street has not arrived on Main Street. Americans are driving less and spending less, fueled by gas prices and a largely jobless recovery."
The drop in U.S. traffic congestion in 2011 follows two years of modest increases in 2009 (1%) and 2010 (10%). The last time America experienced a similar decline was 2008, when traffic congestion plummeted 34%. When analyzed in correlation with 2011 statistics from the Federal Highway Administration, Department of Energy and Bureau of Labor Statistics, the Scorecard provides as much insight into traffic as it does the economy:
- Cities showing the biggest drops in traffic congestion also were cities where gas prices exceeded the national average at its April 2011 peak ($3.96), including Los Angeles ($4.25), San Francisco ($4.25) and Honolulu ($4.48).
- Cities outpacing national employment growth (1.2%), such as Tampa (3%), Houston (3.2%) and Austin (2.1%), showed some of the biggest increases in traffic congestion.
- Cities with moderate employment gains and fuel prices at or below the national average ($3.52) including Atlanta ($3.32, 1.2%) and Miami ($3.52, 1.2%) also showed the biggest increases in traffic.
By analyzing traffic in the nation's 100 largest metropolitan areas in 2011, Inrix determined the Top 10 Worst U.S. Traffic Cities:
1. Honolulu: Drivers waste 58 hours in traffic. Worst time: Tuesday 5:15-5:30 p.m.
2. Los Angeles: Drivers waste 56 hours in traffic. Worst time: Thursday 5:45-6 p.m.
3. San Francisco: Drivers waste 48 hours in traffic. Worst time: Thursday 5:45-6 p.m.
4. New York: Drivers waste 57 hours in traffic. Worst time: Friday 5:30-5:45 p.m.
5. Bridgeport, Conn.: Drivers waste 42 hours in traffic. Worst time: Friday 5:30-5:45 p.m.
6. Washington, D.C.: Drivers waste 45 hours in traffic. Worst time: Thursday 5:45-6 p.m.
7. Seattle: Drivers waste 33 hours in traffic. Worst time: Thursday 5:30-5:45 p.m.
8. Austin: Drivers waste 30 hours in traffic. Worst time: Thursday 5:30-5:45 p.m.
9. Boston: Drivers waste 35 hours in traffic. Worst time: Thursday 5:30-5:45 p.m.
10. Chicago: Drivers waste 36 hours in traffic. Worst time: Thursday 5:30-5:45 p.m.
U.S. Traffic Patterns & Worst Traffic Corridors
Nationwide, Americans traveling the nation's worst traffic corridors experience up to 60 hours of delay annually on their afternoon commutes alone, according to Inrix figures. Of the 162 corridors of at least 3 miles in length that experience heavy traffic congestion every day, the Top 10 Worst U.S. Traffic Corridors are:
1. Los Angeles: A 13-mile stretch of the San Diego Fwy/I-405 NB from I-105/Imperial Hwy interchange through the Getty Center Dr. exit that takes 33 minutes on average, with 20 minutes of delay
2. New York: A 16-mile stretch of the Long Island Expy/I-495 EB from the Maurice Ave. exit to Minneola Ave./Willis Ave. exit that takes 39 minutes on average, with 22 minutes of delay
3. Los Angeles: A 15-mile stretch of the Santa Monica Fwy/I-10 EB from CA-1/Lincoln Blvd. exit to Alameda St. that takes 35 minutes on average, with 20 minutes of delay
4. New York: An intense three-mile stretch of I-678 NB (Van Wyck Expy) from Belt Pkwy to Main St. that takes 13 minutes on average, with 10 minutes of delay
5. Los Angeles: A 17.5-mile stretch of I-5 SB (Santa Ana/Golden St Fwys) from E. Caesar Chavez Ave. to Valley View Ave. exits that takes 40 minutes on average, with 22 minutes of delay
6. New York: A 10-mile stretch of I-278 WB (Brooklyn Queens/Gowanus Expy) from NY-25A/Northern Blvd. to the NY-27/Prospect Expy Exits that takes 31 minutes on average, with 18 minutes of delay
7. Los Angeles: An eight-mile stretch of I-405 SB (San Diego Fwy) from Nordhoff St. to Mulholland Dr. that takes 22 minutes on average, with 14 minutes of delay
8. New York: A six-mile stretch of the I-678 SB (Van Wyck Expy) from Horace Harding Expy to Linden Blvd that takes 20 minutes on average, with 13 minutes of delay
9. Pittsburgh: An intense three-mile stretch of Penn Lincoln Pkwy/I-376 EB from Lydia St. to the US-19 TK RT/PA-51 exit that takes 13 minutes on average with nine minutes of delay in the morning peak period.
10. San Francisco: An 11-mile stretch of the CA-4 EB (California Delta Hwy) from Bailey Rd to Somersville Rd. that takes 16 minutes on average, with 11 minutes of delay.
To see the complete Traffic Scorecard, visit www.inrix.com/scorecard.
More Drivers
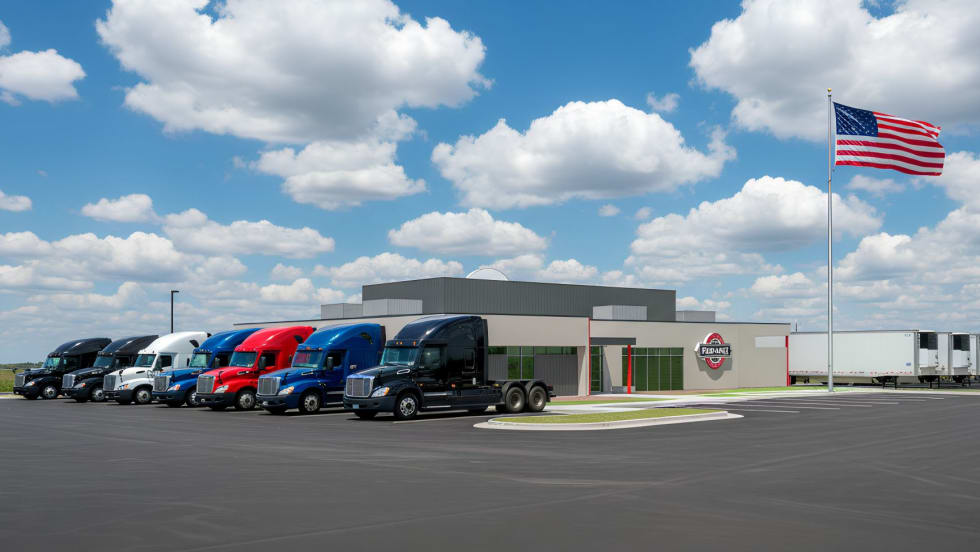
Prime Inc. to Open $7.9M Flagship Used-Truck Dealership
A new driver-focused facility to sell Prime Inc's used trucks and trailers will be the first purpose-built location in the company's history.
Read More →
Short Takes: Inside K&B’s Truck Safety Tech
Listen to learn how K&B Transportation uses cellphone-blocking technology, speed management systems, weather geofencing, bridge avoidance tools, and more to improve driver safety.
Read More →
Nussbaum Expands Driver Compensation with Pay Raises, Profit Sharing
Nussbaum Transportation said its latest compensation package could push first-year driver earnings above $90,000 in key hiring markets.
Read More →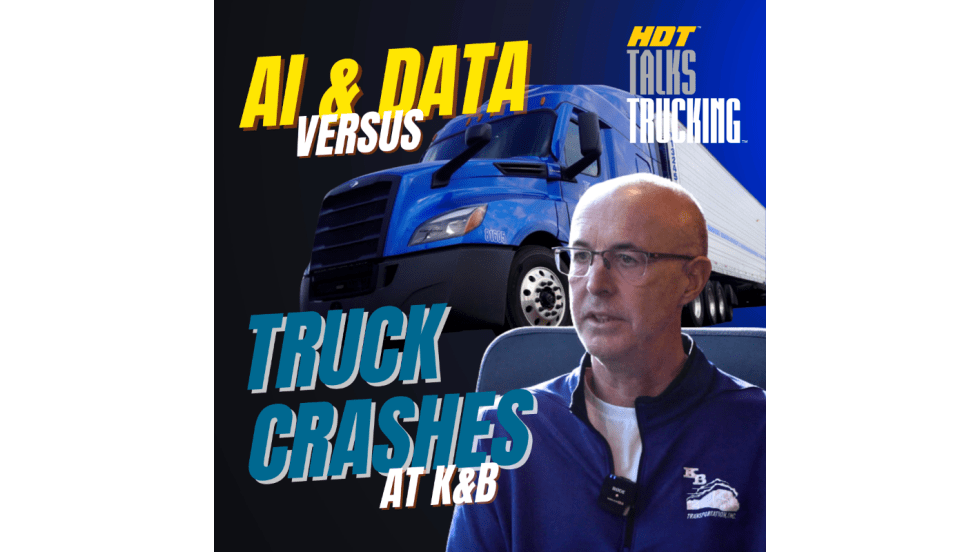
Listen: Inside Modern Fleet Safety: AI, Cameras & Speed Control at K&B Transportation
Fleet safety is evolving fast—and technology is at the center of it. Learn how a former commercial vehicle enforcement officer turned director of safety at K&B Transportation is embracing real-world safety technology.
Read More →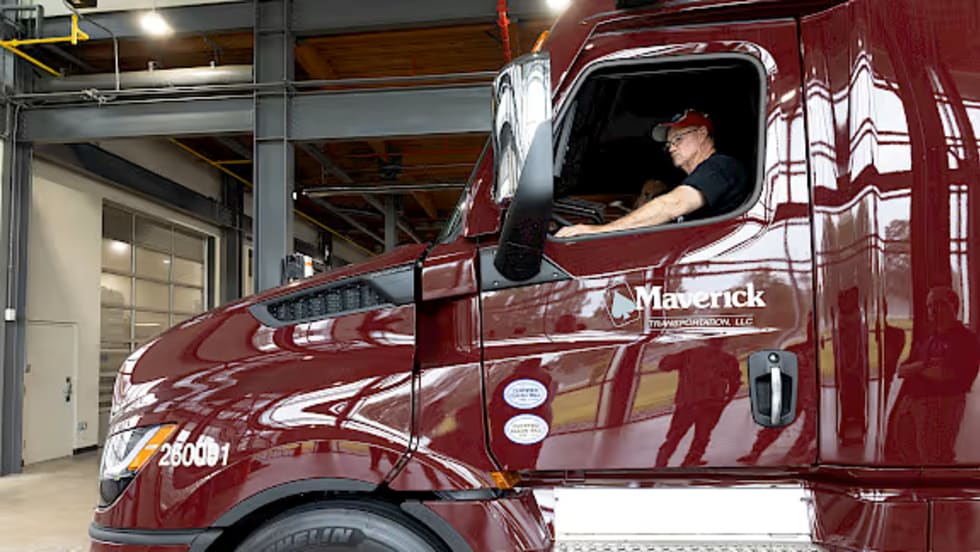
Maverick Announces 2026 Driver Pay Raises
New raises for Maverick Transportation drivers will take effect on May 31, 2026.
Read More →
Illinois Trucker Indicted for Nearly $22,000 in Ohio Turnpike Toll Evasion
Authorities say an Illinois trucker avoided paying tolls for two years, and now faces felony charges, possible prison time, and forfeiture of his Freightliner tractor.
Read More →
New Trojan Driver Cargo Theft Scam Bypasses Carrier Vetting Systems
Cargo theft rings plant operatives as drivers inside legitimate, fully vetted carriers, then execute coordinated thefts that look like a traditional straight theft from the outside.
Read More →
WIM, Trucker Path Name Top 3 Women-Friendly Truck Stops
ATA’s Women In Motion Council and Trucker Path highlight three truck stops that meet all seven safety-focused criteria and rank highest among female drivers.
Read More →
FMCSA Extends Paper Medical Card Exemption … Again
Five states still aren't ready to accept commercial driver medical exam information directly from the medical examiner's registry.
Read More →
Mack Launches Digital Driver Guide for Chassis-Specific Truck Info
Mack’s new, virtual owner’s manual delivers VIN-based, on-demand guidance for vehicle systems via web, app, and soon in-cab displays.
Read More →