




Finding the Needles in the Haystack Under CSA 2010
Under the Federal Motor Carrier Safety Administration's Comprehensive Safety Analysis 2010, or CSA 2010, the FMCSA is going to be looking at five times the amount of data as under the SafeStat system. In addition, carriers are going to be measured by the seven Behavior Analysis & Safety Improvement Categories (BASICs), which are complex measurements of safety performance. For carriers to survive under the new system, they need to understand their CSA 2010 scores
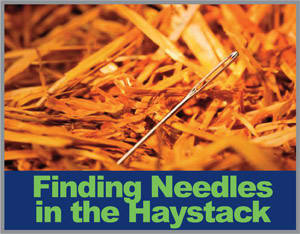
Under the Federal Motor Carrier Safety Administration's Comprehensive Safety Analysis 2010, or CSA 2010, the FMCSA is going to be looking at five times the amount of data as under the SafeStat system. In addition, carriers are going to be measured by the seven Behavior Analysis & Safety Improvement Categories (BASICs), which are complex measurements of safety performance.
For carriers to survive under the new system, they need to understand their CSA 2010 scores.
And with all this data and complexity, the best way to do this is by zeroing in on the fleet's problem areas.
"Where are the needles in the haystack?" asks Sloan Morris, director of client services at Vigillo, which provides fleet risk management solutions. Morris gave his insights on how fleets can best understand and manage their CSA 2010 safety scores during a webinar Tuesday, which was presented by the American Trucking Associations.
Vigillo provides a suite of CSA 2010 offerings, including several scorecards to give carriers an idea of how they stack up under the new system.
Finding the Needles
During the webinar, Morris walked fleets through the Vigillo scorecard system, pointing out ways fleets can best take advantage of such tools.
According to Morris, 68 percent of Vigillo customers have at least one BASIC over the intervention threshold. This is a large percent of fleets that will trigger an invention, whether that's a warning letter or an out-of-service order. "The best intervention is the intervention you don't have," Morris said. "The name of the game is to prevent them from happening."
Morris says the best way to prevent interventions is to identify the problem areas; don't try to address every violation. Under CSA 2010, there are about 1,000 different kinds of violations, but Morris recommends focusing on about 12 violations across the fleet that represent the most points. In most cases, there are about two to three violations per BASIC that are causing the majority of a fleet's points, Morris says.
How do you find these needles in the haystack? Vigillo's system drills down a fleet's score by violation, BASIC, driver and root cause.
By BASIC, Violation
With Vigillo's system, a carrier can see how they compare to others in their peer group under every BASIC. For fatigued driving, driver fitness, vehicle maintenance and cargo securement BASICs, carriers will be compared to peers based on the number of relevant inspections, or an inspection where a driver or carrier did get a violation or could have, Morris said. For the other BASICs, carriers will be compared by the number of power units they have in the Vigillo system. If you're underreporting the number of power units in your fleet, this could negatively affect your score, he added.
Drilling down by BASIC, fleets can see which violations in that BASIC are most prevalent. Under the violations tab, carriers will see the problem areas across all BASICs.
By Driver
"Your drivers are the building blocks of CSA 2010," Morris said.
Vigillo also drills down the data by driver, showing each driver's percentile rank within the fleet across all BASICs as well as their performance in each individual BASIC.
In addition to looking at multiple drivers at once, the Vigillo system allows a fleet to look at individual drivers' performance through a Driver Profile. Morris said many fleets like to print these out and hand them out to drivers for coaching and education. These scorecards can help drivers continue as a professional driver, he said. "It makes a strong impact on the drivers, and everyone's on the same page."
Inspection Root Cause
Vigillo also presents a carrier's data through an Inspection Root Cause Scorecard, which shows the areas that are triggering an inspection in the fleet. The idea is that if you reduce the number of inspections in your fleet, you're bound to cut down the number of violations in turn.
Vigillo's analysis of CSA 2010 data on more than 400,000 drivers and over 1,000 carriers found that 81 percent of violations are triggered by things drivers can control, such as speeding and observable defects. Nineteen percent of violations are triggered by other things. The new Root Cause Scorecard pinpoints areas that carriers need to address with drivers to lower risk and costs.
More Drivers

When Language Stops the Truck: The Return of ELP Out-of-Service Orders
English language proficiency rules for commercial drivers aren’t new, but renewed out-of-service enforcement has raised the stakes. Here’s what carriers need to know before a driver reaches a roadside inspection.
Read More →
Samsara Launches Custom AI Agent Builder
Agent Studio lets fleets create AI tools for hours-of-service monitoring, reporting and driver support, including agents that communicate by phone.
Read More →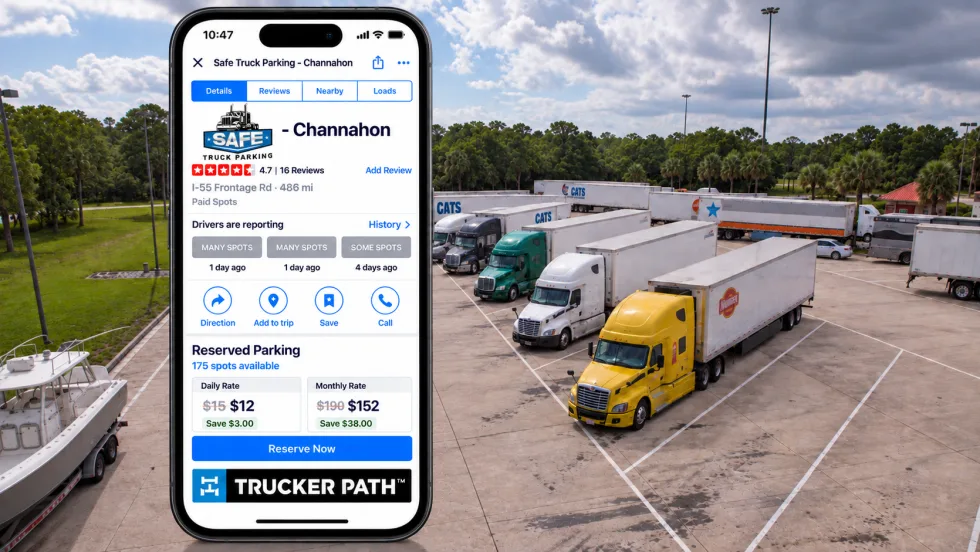
Trucker Path Expands Reserved Parking Network
Trucker Path has added close to 6,000 more truck parking spaces to its Trucker Path Reserved Parking Network with the addition of Safe Truck Parking.
Read More →
EEOC Sues Texas Trucking Company Over Driver Age Limits
The agency says Trancasa USA rejected applicants over 65 and applied tougher driving-record standards to those over 60.
Read More →
Nussbaum, Roehl Announce Second Driver Pay Increase This Year
This year has seen a swath of major truck driver pay increases as freight capacity has tightened.
Read More →
From One Generation to the Next: How Mentorship Builds Safer Truck Drivers
After three decades in trucking, Harold Perry shares what he's learned about driver safety, mentorship, and helping the next generation build confidence behind the wheel.
Read More →
Truck Drivers Need More Than Another Alert
Fleets have more visibility into truck health, safety events, and driver activity than ever. The next challenge is turning all that information into useful guidance for the person who has to decide what to do next.
Read More →
FMCSA Removes 110 Truck Driver Training Schools from Certified ELDT List
Federal regulators also are targeting more than 160 additional training providers and launching a nationwide audit of third-party CDL skills testers as part of a broader crackdown on trucking fraud.
Read More →
Hours of Service Pilot Programs: FMCSA Readies for 2027 Rollout
Two pilot programs could eventually reshape hours-of-service rules, giving truck drivers options to pause their 14-hour clock or use longer split sleeper rest periods.
Read More →
Medical Cards, English Proficiency Reshape Roadcheck Violations
Medical-card violations jumped to the top of the driver out-of-service list during CVSA’s 2026 International Roadcheck, while English-language proficiency violations appeared among the leading violations for the first time.
Read More →