

DAT Offers Freight Market Analytics Online
DAT Solutions has launched an online analytics service for transportation and logistics professionals to access truck and load data on the 149 North American markets with the highest concentrations of inbound and outbound freight.
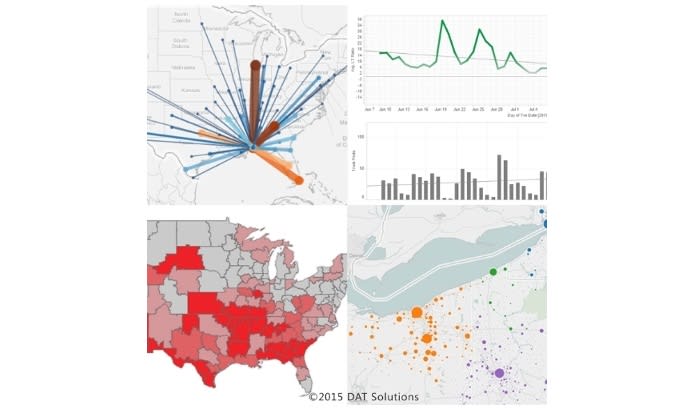
Image: DAT Solutions

DAT Solutions has launched an online analytics service for transportation and logistics professionals to access truck and load data on the 149 North American markets with the highest concentrations of inbound and outbound freight.
Through a Tableau web portal, users can access a set of trucking freight data visualizations. Users also have the option of importing data into their own systems.
Information can be sorted by individual and multiple key market areas to customize charts and maps of current or historical trends in demand and capacity.
Market data comes from DAT Load Boards, which host over 120-million load and truck posts each year. Information also comes from DAT RateView, which compiles more than $24 billion in freight bills annually.
"For years, DAT Solutions has provided volumes of data on the 65,000 lanes we track," said Greg Sikes, vice president of products for DAT Solutions. "We developed this data analytics service through close collaboration with several top 50 third party logistics companies who are now benefitting from enhanced planning, carrier prospecting and benchmarking capability."
Available data visualizations include:
Carrier development charts - Provides carrier load-search and truck-posting activity by company and key market area, so users can identify potential business partners in the lanes they run.
Supply/demand heat maps - Shows the number of available freight loads vs. the number of available trucks in each key market area. This "load-to-truck ratio" is a leading indicator of whether truckload rates on the sport market will rise or fall, and can signal changes in contract freight rates.
Inbound/outbound trucks and loads map - Shows loads and trucks inbound and outbound for each key market area, to help users better understand freight volume patterns between cities.
Truck density maps - Shows the concentration of trucks by equipment type within specific geographies. These maps can help carriers understand where to position trucks, or can help shippers when deciding where to locate a plant or distribution center.
For more information, click here.
More Fleet Management

How Innovative Trucking Leaders Turn Change Into an Advantage
As the pace of change accelerates in trucking, the fleets that adapt best have more than the latest technology. They have cultures that embrace improvement.
Read More →
Freight Broker Bonds Just Got Harder to Get. Here's What That Means for Your Fleet.
When it gets harder for a freight broker to prove they are financially sound, the ones who cannot clear that bar get pushed out of the market. And those are exactly the brokers who used to leave motor carriers holding the bag.
Read More →
Long-Awaited Canadian Border Bridge to Open in Detroit
For trucking, the bridge opening should offer immediate improvements in efficiency and reliability, with new customs facilities, expanded inspection capacity, and direct freeway-to-freeway connections.
Read More →
Aurora Rolls Out Next Generation of Driverless Trucks for Commercial Freight
Aurora's latest autonomous trucks it's rolling out with International feature lower-cost hardware designed for a million miles as the company expands commercial driverless freight operations across the U.S. Sun Belt.
Read More →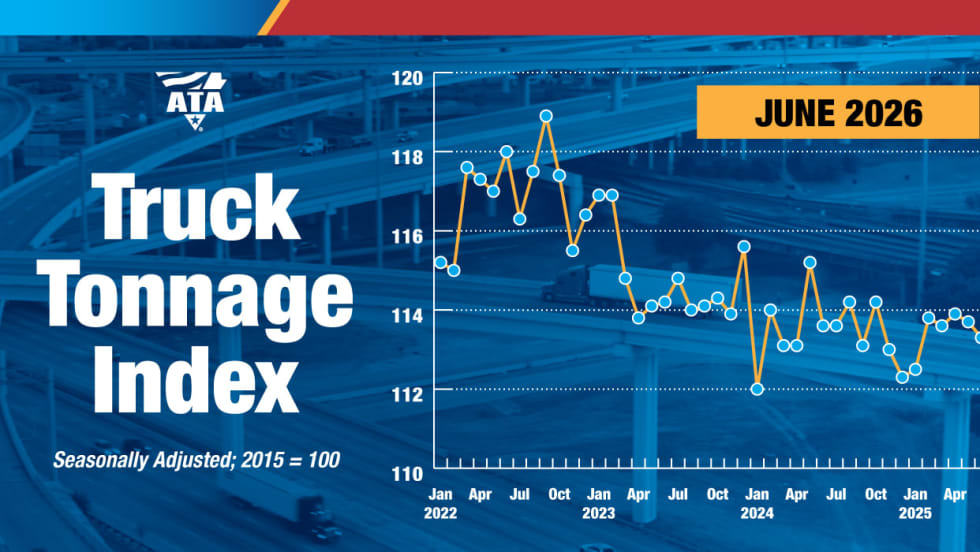
Freight Tonnage Down, Rates up, as Lower Capacity Powers Trucking Recovery
The recovery from the freight recession continues to be driven by reduction in capacity rather than by increased demand.
Read More →
Think Your Trucking Fleet Isn't Using Much AI? Think Again
Shadow AI — the use of unauthorized artificial intelligence tools at work — is becoming increasingly common, putting sensitive company data at risk. Learn how trucking fleets can protect sensitive data while embracing AI.
Read More →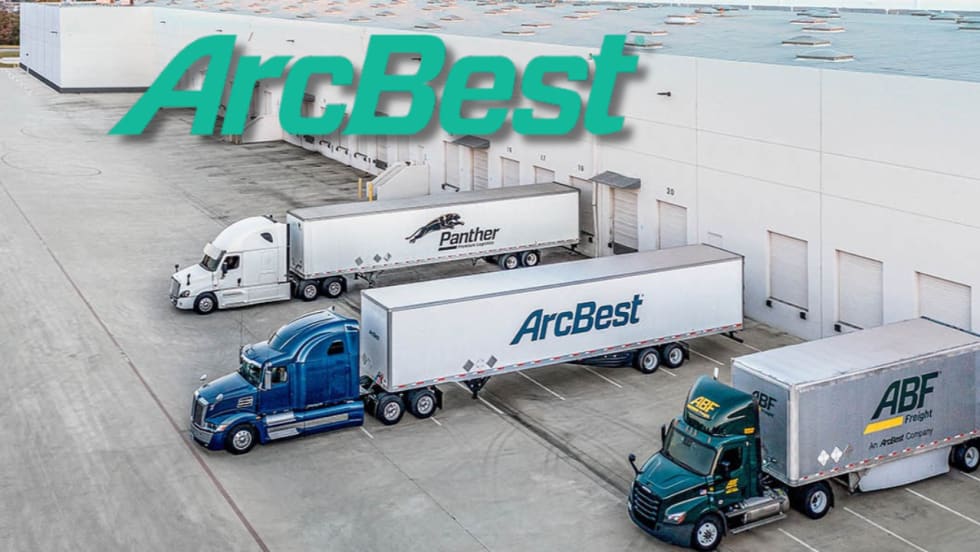
ArcBest Consolidates Brands, Cuts Workforce
The company will bring three business units under the ArcBest brand, eliminate about 2% of positions, and expects the changes to generate $40 million in annual savings.
Read More →
Trucking Fleets Faced Record Operating Costs During Third Year of Freight Recession
ATRI's annual operational cost report shows carriers trimmed fleets, delayed equipment purchases, and ran older trucks as expenses continued to outpace freight rates.
Read More →
Michelin Adds AI Assistant to MyConnectedFleet Platform
Michelin’s new generative AI tool delivers instant fleet insights, helping managers analyze fuel use, tire maintenance, vehicle status, and operational performance without manually creating reports.
Read More →
LytxOne Platform Now Features AI, Compliance, and Asset Tracking Tools
New enhancements add AI-powered insights, asset tracking, compliance automation, and configurable privacy controls to Lytx's all-in-one fleet management platform.
Read More →