


"Chocolate doesn’t fit under the category of 'finished metal shapes.' Nor do pharmaceuticals or watches. So that brings us to gold, specifically pure gold – the kind they keep at Fort Knox."
Record January Imports Didn't Produce Much Freight
FTR's Avery Vise digs into the numbers behind January's import surge in this column.
March 13, 2025

Once again, a surge in imports did not translate into a surge in truck freight.
Image: HDT Graphic
4 min to read
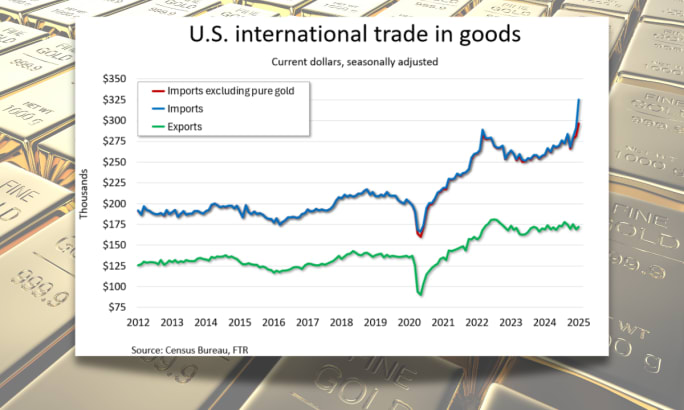
U.S. imports of goods in January surged 12.5% month over month, seasonally adjusted, to an all-time high. But we didn't see that reflected in the freight market.
Although several major categories of imports rose during the month, the standout was industrial supplies, which jumped more than 34% month over month in January after rising 19% in December.
Detailed data showed that a category called “finished metal shapes” was responsible for almost all the strength in industrial supplies imports, jumping 149% in January after soaring 202% in December.
Is January Import Surge Tariff Threats at Work?
“Finished metal shapes” is a rather vague and broad descriptor that sounds like it would be what we think of as fabricated metal products.
The notion that there would be a surge in December or January would not be surprising given an expectation for tariffs, but the scope of that increase seemed inconceivable.
A clue to the source of the surge comes from January’s ranking of exporters to the U.S in terms of dollar value. The top three are always the same: Mexico, China, and Canada.
The fourth largest exporter in January, though, was rather shocking. Switzerland beat out the likes of Germany, Vietnam, Japan, Taiwan, and South Korea, among others. In both 2024 and 2023, Switzerland was only the 15th largest exporter of goods to the U.S. in dollar value.
Although several major categories of imports rose during the month, the standout was industrial supplies, which jumped more than 34% month over month in January after rising 19% in December.
Image: HDT Graphic from FTR data
Chocolate doesn’t fit under the category of “finished metal shapes.” Nor do pharmaceuticals or watches. So that brings us to gold, specifically pure gold – the kind they keep at Fort Knox.
The type of gold is notable because another commodity within the broad category of industrial supplies is nonmonetary gold, which also saw a sizeable increase but nothing like finished metal shapes. Nonmonetary gold presumably is for more industrial uses, like gold-plating and filling tooth cavities. Switzerland is the largest supplier of pure gold to the U.S. by far.
Pure gold normally does not account for much of America’s imports in dollar value. For example, the monthly average dollar value was about $1 billion in 2023, and with rising prices, the average during July through November 2024 had risen to about $1.45 billion a month.
Gold imports then jumped to $9.7 billion in December. That sounds like a lot — until you learn that the value of gold imports in January skyrocketed to $28.7 billion, according to Census Bureau data.
Why Was Switzerland Sending So Much Gold to the U.S.?
The factors behind the surge are speculative, but it isn’t a function of price. Gold prices have risen this year, but current prices are only about 10% higher than they were at the beginning of the year.
Two possibly interrelated factors likely were at play.
President Trump campaigned on universal tariffs, and a 10% to 20% tariff on something that costs $2,900 an ounce is big money, even for someone who can afford it in the first place. So, like many goods, importers could have been trying to get ahead of the tariffs.
The second and more troubling possibility stems from the fact that gold is the go-to hedge for people worried about the stability of the U.S. and/or global financial markets. The last sustained run-up in pure gold imports was in the lockdown phase of the pandemic in 2020.
Regardless of the reason, pure gold obviously does not generate any significant freight volume.
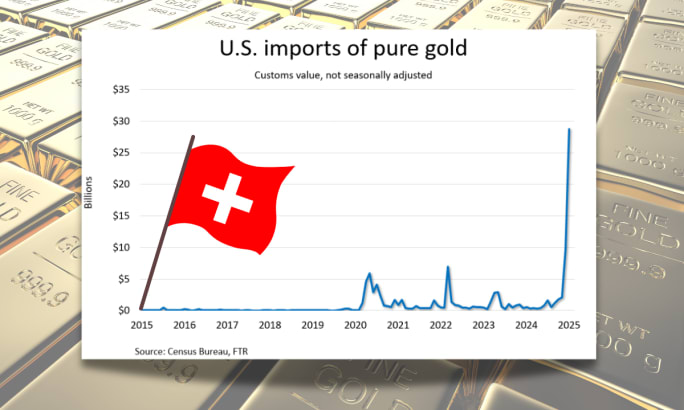
Gold imports jumped to $9.7 billion in December. That sounds like a lot — until you learn that the value of gold imports in January skyrocketed to $28.7 billion.
Image: HDT Graphic from FTR data
How Many Trucks Would You Need to Transport $28.7 Billion in Gold?
How much freight would it be? Clearly, gold bars and ingots would not move by tractor-trailer once they arrived in the U.S., but just for fun let’s assume they did.
In January, the average price of gold was about $2,700 an ounce. Therefore, $28.7 billion in gold equals about 10.6 million ounces, or 664,000 pounds.
Assuming a tractor-trailer payload of 45,000 pounds – and I think we can safely assume the loads would gross out before cubing out – that’s fewer than 15 full truckloads of gold. Imagine the cargo insurance policy premium!
As noted earlier, the surge in gold was not the only strength for imports. January imports were a record even excluding gold from the calculation. However, the principal strengths came in areas that are high in value but low in freight impact – items like computers and pharmaceuticals.
Subscribe to Our Newsletter
More Fleet Management

What Geotab's New AI Connector Means for Fleets
Fleets can now ask their usual AI assistants questions about maintenance, safety, fuel use, and vehicle performance, using their live Geotab data, and take action on the answers without leaving their preferred AI tool.
Read More →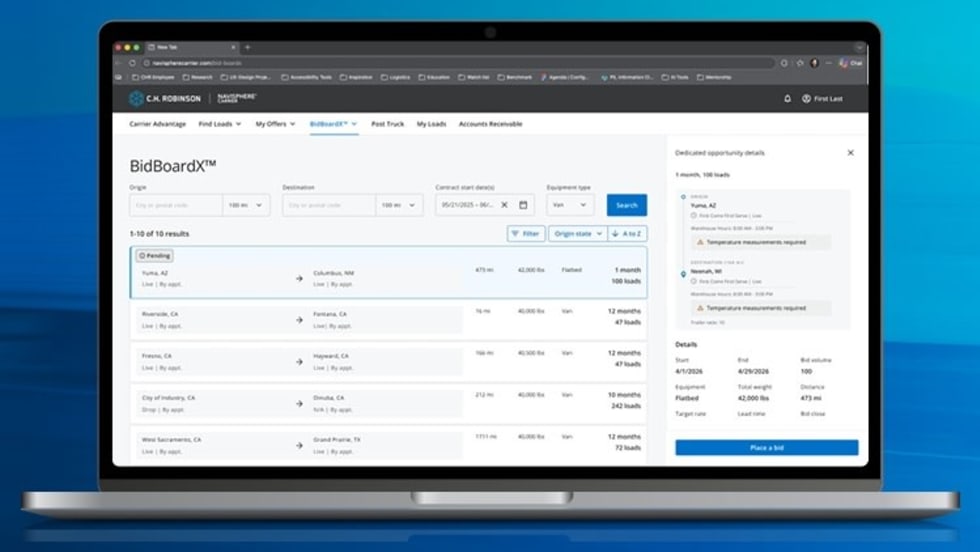
New C.H. Robinson Tool Opens Door to More Predictable Freight
BidBoardX lets carriers search, bid on, and secure committed freight opportunities through a single digital marketplace.
Read More →
New York City's Microhub Project is Delivering Results
Trucking, last-mile delivery companies, and environmental advocates like what they are seeing so far with New York's microhub program.
Read More →

Why Truck Detention Keeps Costing Fleets Time and Money
A 2024 ATRI study found detention affects nearly 40% of truckload stops and costs the industry more than $15 billion annually. Despite the toll on drivers, fleets, and supply chains, the problem remains stubbornly persistent.
Read More →
Time is Running Out to Apply for Exclusive HDT Event
Heavy Duty Trucking Exchange brings fleet managers and suppliers together for the deeper conversations that lead to ideas, partnerships, and solutions. Time is running out to apply for the September event.
Read More →
Amazon Launches Less-Than-Truckload Freight Offering for All Businesses
This launch is the latest addition to Amazon Supply Chain Services, a portfolio of supply chain capabilities from Amazon, including freight, distribution, fulfillment, and parcel shipping.
Read More →
Import Cargo Volume to See Year-Over-Year Gain Again in June, Then Remain Below 2025 Levels Into Fall
After July, the report predicts a weakening in import volume as consumer uncertainty remains high and the impact of increasing inflation takes its toll.
Read More →
Sponsored•June 8, 2026
AUCTION OF EQUITY INTEREST IN HEAVY HAUL TRUCKING COMPANY!!
Mark your calendar: June 30, 2026 (10:00 a.m. PDT). A 37.5% ownership interest in MagnaTrans, LLC, a California limited liability company doing business as Magna Transportation Group, will be sold in an in-person and online auction to the highest bidder or bidders under Article 9 of the Uniform Commercial Code. The Rancho Cucamonga-based heavy haul and over-dimensional trucking company operates across California, Oregon, and Arizona.
Read More →
Volvo Trucks Adds Unattended Over-the-Air Software Update Capabilities
The latest evolution of Volvo’s over-the-air update technology allows software updates to run while trucks are parked, helping fleets keep vehicles current without disrupting operations.
Read More →
How Waste Connections is Using Data, Telematics, and AI
How do you manage and maintain more than 18,000 connected trucks? Data. Lots of it.
Read More →