

Getting the Most from Your Limited Budget Through Life-cycle Cost Analysis
Financial constraints often force fleet managers to make tough equipment decisions. Should I repair a vehicle or replace it
Financial constraints often force fleet managers to make tough equipment decisions. Should I repair a vehicle or replace it?
If I do repair it, how much work should I do? Just enough to get by or a complete overhaul? Is it better to replace two low-cost units or one higher-cost unit?
In far too many cases, the answers to these questions are based on educated guesses or are driven by external decision-makers with their own agendas. One of the best financial analysis tools available to fleet managers for making decisions of this nature is the net present value (NPV) life cycle cost analysis. Instead of relying on guesswork, and not being able to fully defend your position, a NPV life-cycle cost analysis will show you the true total cost of each alternative.
Many fleet managers have used life-cycle cost studies for years. Unfortunately, the usual study only considers direct cash flows. A typical logic thread might be something like: If I spend $1,000 today, I will save $250 a year, which means I will recoup my investment in four years.
There are two faults with this type of analysis. First, it does not consider the time value of money. Secondly, decisions made by a fleet manager working for a tax-paying entity have a direct impact on the taxes the entity pays. An after-tax NPV life-cycle cost analysis addresses both of these issues.
What is the Difference?
The time value of money is directly related to an entity's cost of money. A tax-paying business's cost is normally considered to be its minimum acceptable internal rate of return. For a government agency, it is typically the weighted cost of debt (direct loans, bonds, etc.). This cost of money, which is normally expressed as a percentage, means that one dollar at some point in the future, is worth less than a dollar in hand today. For a given cost of money, the current value of a dollar at some point in the future is known as its present value. The total present values of a series of related expenditures, spread over a period of time, is referred to as the net present value.
If an entity pays taxes, the fleet manager must also consider the true bottom-line cost of an expenditure after taxes. Ordinary expenses reduce gross income, which in turn reduces tax liabilities. This effect is known as a tax shield. For example, if your entity has a total effective tax rate of 30%, a dollar of ordinary expenses only costs 70 cents after taxes. Capital expenditures, on the other hand, must be depreciated over a period of years, so the NPV of the series of depreciation allowances is less than the actual capital expenditure.
The following is a very basic example of a tax shield. Let's say that your business has a tentative gross profit of $1,000 for a period, and the effective tax rate is 10 percent. That means that you will owe $100 in taxes for the period, leaving you with a net income of $900. If you incur an expenditure of $100, your gross profit will drop to $900 and your tax liability will drop to $90. That means that your net income will be $810, so the additional $100 expenditure actually only costs you $90 after taxes. Many businesses have total effective tax rates in excess of 40% to 50%, so the impact of a tax shield can be very significant to the bottom line.
Using an After-Tax NPV Life-cycle Cost Analysis
Admittedly, most fleet managers are not familiar with this type of financial analysis, but available spreadsheet programs perform the calculations for you once you input the necessary information. The biggest single issue the fleet manager faces with this type of analysis is that it documents the total cost to the entity, as opposed to just the fleet manager's budget. However, your financial people are probably very familiar with the concept, so if you are in a position to work with them, you may be able to use this type of analysis to document your stewardship of the entity's budget and get additional funds when justified by your analysis.
When you make an NPV analysis of a series of expense options, the NPVs of the various alternatives will be negative. The option with the least negative cost is the best alternative from a purely financial point of view. Some NPV life-cycle cost spreadsheet programs, such as the NTEA's Vehicle Life-cycle Cost Analysis Program will also show your annualized cash flows. If the NPVs of two options are very close, these annualized cash flows may be more important than the total cost.
In the case of revenue-producing alternatives, the NPV will be positive if the alternative being considered is earning more than the established cost of money and negative if it is earning less. An alternative can be revenue-generating even if there are no direct income flows associated with it. For example, you may be considering upgrading a new truck in such a way that will be more productive. If the operations associated with the existing truck incur a significant amount of labor overtime, the increased efficiency may eliminate that overtime. The loaded overtime rate (say $50 per hour), times the total hours of overtime eliminated (say one hour per day x 260 days per year), generates a direct labor savings for the company which can be treated as additional revenue. Using the hypothetical numbers stated, the annual savings (revenue) would be $13,000.
If you can increase the productivity of a new unit to the point that it will replace two existing units, the potential savings (revenue) may be even greater since you will be eliminating the total labor costs of a driver (and possibly a helper), as well as the maintenance and operating costs of the second truck. The opposite of this scenario applies when people in your entity want to downsize a vehicle to reduce fuel costs. If this downsizing increases overtime, or forces the addition of a second vehicle to get the work done, the fuel savings will probably be less than the other costs incurred.
Even replacing a high-cost unit with a new unit that has a lower life-cycle cost can be considered revenue-producing, since it may reduce total life cycle expenditures. For example, if you have a vehicle with a lifetime average operating cost of $1.50 per mile, and the truck runs 15,000 miles per year, your annual costs will be $22,500. A new, more fuel-efficient vehicle may have a projected average annual operating cost of $1.10 per mile or $16,500 per year. Therefore, the cost reductions (revenues) associated with the new unit will be $7,000 per year.
Of course, as we have seen, the actual bottom line in these examples is not without some complexity. If you work for a tax-paying entity, the reduction in labor payments will eliminate a tax shield. In addition, the cost of the upgraded vehicle must be depreciated over time as opposed to being treated as a one-time expense. In all cases, the carrying costs (time value of money) must also be taken into account. However, a properly applied NPV life-cycle cost analysis will take all of these factors into consideration and the true costs of each option.
Ranking Alternatives
If you have a number of revenue-producing alternatives, and only enough money to fund part of them, you can perform an NPV analysis and determine the actual return for each alternative. The individual rates of return can then be used to rank the alternatives. For example, let's say you have five projects, with a total cost of $450,000, but you have only been allocated $360,000. An NPV analysis provides the following information:
Project Cost Actual ROI Target ROI
1 $150,000 18.2% 15.4%
2 $100,000 20.3% 15.4%
3 $ 75,000 12.9% 15.4%
4 $ 25,000 14.6% 15.4%
5 $100,000 15.1% 15.4%
Total $450,000
In this case, Project 2 has t
More Fleet Management

How Innovative Trucking Leaders Turn Change Into an Advantage
As the pace of change accelerates in trucking, the fleets that adapt best have more than the latest technology. They have cultures that embrace improvement.
Read More →
Freight Broker Bonds Just Got Harder to Get. Here's What That Means for Your Fleet.
When it gets harder for a freight broker to prove they are financially sound, the ones who cannot clear that bar get pushed out of the market. And those are exactly the brokers who used to leave motor carriers holding the bag.
Read More →
Long-Awaited Canadian Border Bridge to Open in Detroit
For trucking, the bridge opening should offer immediate improvements in efficiency and reliability, with new customs facilities, expanded inspection capacity, and direct freeway-to-freeway connections.
Read More →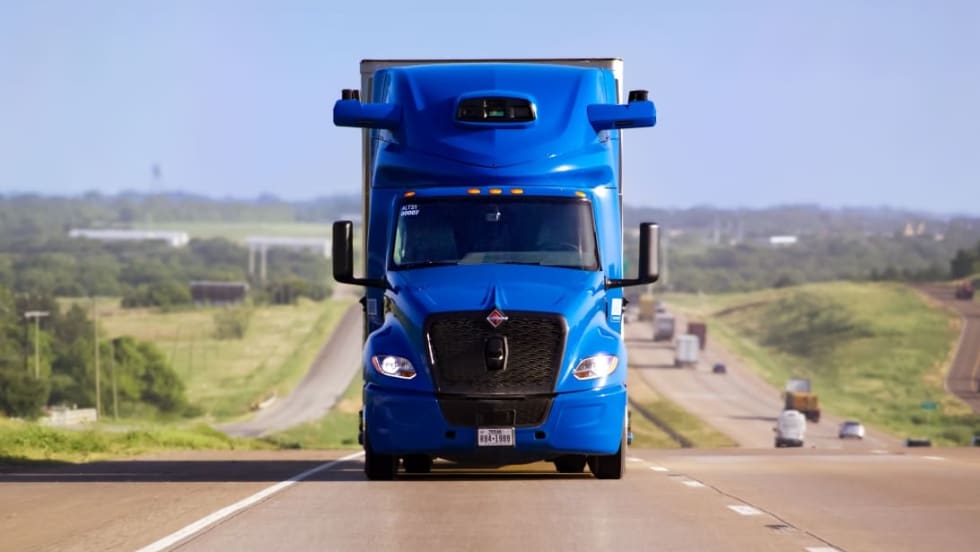
Aurora Rolls Out Next Generation of Driverless Trucks for Commercial Freight
Aurora's latest autonomous trucks it's rolling out with International feature lower-cost hardware designed for a million miles as the company expands commercial driverless freight operations across the U.S. Sun Belt.
Read More →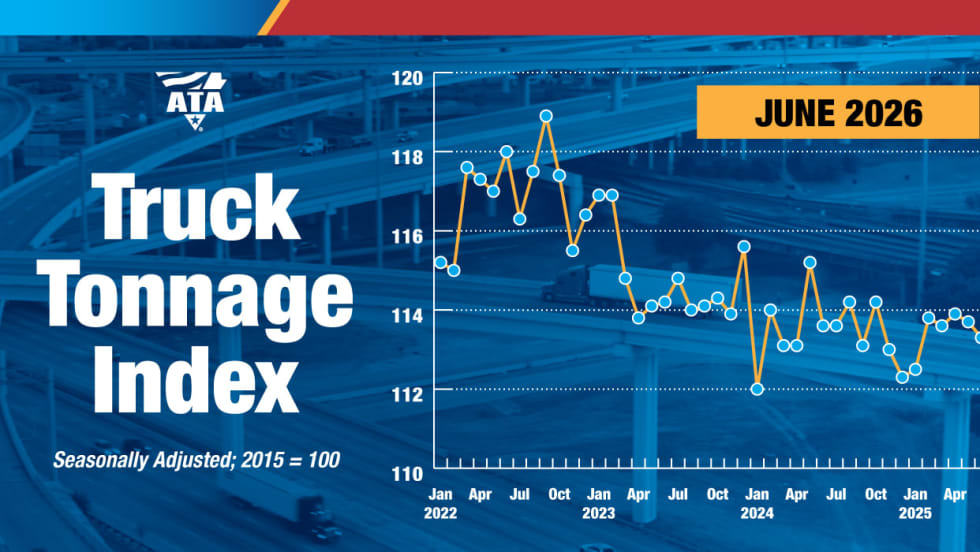
Freight Tonnage Down, Rates up, as Lower Capacity Powers Trucking Recovery
The recovery from the freight recession continues to be driven by reduction in capacity rather than by increased demand.
Read More →
Think Your Trucking Fleet Isn't Using Much AI? Think Again
Shadow AI — the use of unauthorized artificial intelligence tools at work — is becoming increasingly common, putting sensitive company data at risk. Learn how trucking fleets can protect sensitive data while embracing AI.
Read More →
ArcBest Consolidates Brands, Cuts Workforce
The company will bring three business units under the ArcBest brand, eliminate about 2% of positions, and expects the changes to generate $40 million in annual savings.
Read More →
Trucking Fleets Faced Record Operating Costs During Third Year of Freight Recession
ATRI's annual operational cost report shows carriers trimmed fleets, delayed equipment purchases, and ran older trucks as expenses continued to outpace freight rates.
Read More →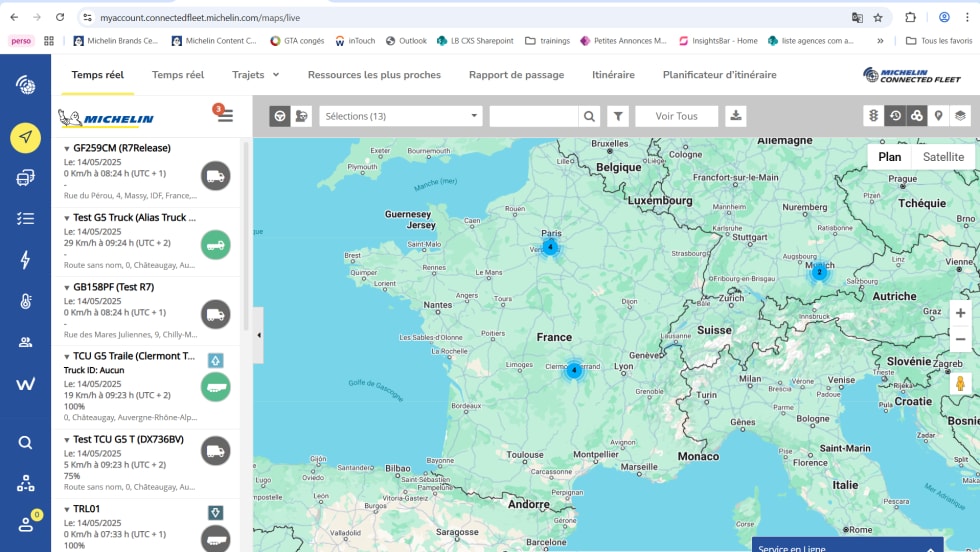
Michelin Adds AI Assistant to MyConnectedFleet Platform
Michelin’s new generative AI tool delivers instant fleet insights, helping managers analyze fuel use, tire maintenance, vehicle status, and operational performance without manually creating reports.
Read More →
LytxOne Platform Now Features AI, Compliance, and Asset Tracking Tools
New enhancements add AI-powered insights, asset tracking, compliance automation, and configurable privacy controls to Lytx's all-in-one fleet management platform.
Read More →