


Related: Integrating Data: Identifying Untapped Opportunities for Fleets
5 Steps to Get the Most From Your Analytics
As technologies that collect data have become more readily available and affordable, fleets of all sizes have begun studying the data from various sources within their business.
September 17, 2020

You have to have put in place a way to measure the success of the analytics.
Photo: Gettyimages.com/enisaksoy
7 min to read
Putting data to work has been a topic within the trucking industry for some time. As technologies that collect data have become more readily available and affordable, fleets of all sizes have begun studying the data from various sources within their business: operational data from their transportation management software, location and sensor data from telematics, vehicle data from the maintenance system, and other various sources such as safety and HR. Now-mandatory electronic logging devices record driver hours, vehicle location and engine operation, opening up a new trove of data.
Much of that data can be used to gain businesses intelligence, or insights, into various parts of the business. However, you don’t just turn on the data machine and have it spit out results. To be effective, any kind of effort should consider the following steps.
1. Decide Where to Start
The reason companies take the effort to analyze their data is so they can better understand inefficiencies and other areas within the operation that can be improved.
“Often the list of problems is long, so there is a need for focus,” explains Ashim Bose, chief data scientist and vice president of artificial intelligence/machine learning at Omnitracs. “Prioritize this list based on business value.”
Without a clear focus, he warns, it’s easy to “fall into the trap of ‘boiling the ocean’ in an unfocused manner.”
The list of things you could focus on is long: fuel economy, revenue per mile, routes, safety, etc. Each fleet will have its own priorities. “Every customer is different, but there are some common returns on investment from using the data,” says Mix Telematics’ Jonathan Bates, such as being able to get more affordable insurance rates by focusing on safety data and how to improve it.
At Werner Enterprises, for instance, the focus is on equipment maintenance, safety, and utilization, according to Danny Lilley, vice president of fleet systems and technology and an HDT 2020 Truck Fleet Innovator.
2. Get Your Data Ready
After settling on the problem or problems you want to investigate, you have to identify the type of data you need and where it can be found. That provides “a starting point for data wrangling,” Bose says.
“The first thing I would do is decide what parts go together — what are apples, what are oranges,” says Barry Brookins, director of data science at McLeod Software. For instance, if you are monitoring driver behavior, you don’t want to compare a city driver with a long-haul, team driver.
Chris Orban, vice president of data science at Trimble Transportation, agrees. “One of the first things that any fleet can do [is] understand the data you are looking at and understand what problem you are trying to solve.”
For instance, if you want to analyze vehicle failures, data sources might include engine data from a telematics system or data downloads, repair histories from maintenance software, warranty information, and so on. This information is most likely already being used by various people within your company, who Orban refers to as your “best data experts.”
Once you understand the data sources, then you move into getting “clean data.”
This is a very important step, Lilley says. “Clean, organized data, so that the context is well understood, is essential to any analytical exercise and often the most time-consuming aspect of analytics.”
Criss Wilson, data scientist, McLeod Software, recommends recognizing what tools you already have. In other words, does the software you are using now have business intelligence capabilities? If yes, you next look at the different databases you have. “It’s important to understand where the data is and how you are going to work with it,” he says. This will include identifying the common data points between the databases. That might be vehicle ID, driver ID, order number, or other fields that are common between data sources.
Then, it comes to cleaning the data. A common problem with getting your data in order is to get rid of duplicates, which are common when multiple people key in duplicate data, Orban says. For instance, you may have multiple data on one driver or multiple customer entries.
Cleaning data can be time-consuming. Orban recommends that fleets work collaboratively with their software vendors on this task. While many vendors can “clean” the data, there may be reasons for some duplicates that they wouldn’t know about, which is why it’s important to have the fleet’s data experts involved.
Focusing on processes helps ensure the data going in is useful later. Various departments are all contributing to databases on vehicles, drivers, customers, freight lanes, etc. “You have to make sure everyone is speaking the same ‘data language,’” Orban adds. For instance, there should be clear definitions for things such as reportable accidents or late loads, so the data input is consistent across staff and departments.
3. Have a Plan
Before jumping into the deep end of the data pool, understand what you are looking for. “It is very important to have a hypothesis that can be tested to validate the result,” Lilley says. Each of these tests can show whether or not your approach can provide the end result you are looking for. “Continuous experimentation is critical to identifying the things that could be extremely important.”
You have to have put in place a way to measure the success of the analytics, says Mike Branch, vice president of data and analytics at Geotab.
In addition, you need to “establish the time frame,” Trimble’s Orban advises. If you focus on too short a time frame, the past week for instance, what you find may not be a trend, but just a seasonal variation. Therefore, it’s key to look at a long enough time period to tease out simple variations.
4. Let the Data Do the Talking – Keep an Open Mind
When the analytics process starts producing results, it’s important to keep an eye on the data you are working with, “everything from data quality to volume,” Branch says. In the initial phases, it may help to develop “simple visualizations via graphs that allow both the business and data experts to be aligned.”
Most fleet managers already have a fairly good understanding of their company. But sometimes, the data results may not jibe with their expectations. That doesn’t mean that either of the two is wrong.
“If the data doesn’t agree with what you’ve been finding, that can be tough,” says McLeod’s Brookins. For instance, if the analytics ranks a customer higher on the list than the manager would have, look at other factors the analytics model considered – or didn’t consider. Maybe drivers score that customer tops because the people there are great to work with and get them in and out on time. If you only look at rates in your data analysis, you might overlook other factors that make a customer a good customer. Brookins says that kind of 360-degree view can help you make better choices.
Even if you already have a pretty good handle on the metrics you use to measure your business, the bottom line is to keep an open mind. Understand that there is no perfect analysis, so don’t blindly accept a model’s results. Be open to learning something new.
“You never know where the data will lead, and often you stumble upon an insight that you were not considering,” Lilley says.
5. Put What You’ve Learned to Work
Gaining new insight into how your company is operating is not the end the of the journey. Putting those insights to work is the payoff. “Teams often focus on generating insight, but sometimes neglect to focus on how those insights will be utilized,” Lilley says.
You can’t get bogged down in the data. “You can have a problem with trying to look at too many pieces of data,” Brookins says.
But looking at too little can also be a problem. For instance, ranking drivers by revenue generated on one list and safety on another list may result in completely different lists. A deep analysis of data, on the other hand, can combine those data points, plus others, to provide a more accurate picture.
Just as important as finding the insights is getting that information to the right people on your staff. Branch says that could be accomplished with an email alert, a dashboard or a software application. But whatever method you use, it needs to “convey the result of the project to the people that require the insight in the business.”
Perhaps more important, Branch says, is “tracking the performance of the insight that you’ve developed against the success criteria outlined” earlier in the process.
Lilley says that in the future, advances in business intelligence and machine learning technologies could automatically integrate the insights gained into your business processes. In that case, “the analytics will be performed by technology,” which will then initiate actions, providing almost immediate operational adjustments. In this scenario, the data knows best.
Subscribe to Our Newsletter
More Fleet Management

How Innovative Trucking Leaders Turn Change Into an Advantage
As the pace of change accelerates in trucking, the fleets that adapt best have more than the latest technology. They have cultures that embrace improvement.
Read More →
Freight Broker Bonds Just Got Harder to Get. Here's What That Means for Your Fleet.
When it gets harder for a freight broker to prove they are financially sound, the ones who cannot clear that bar get pushed out of the market. And those are exactly the brokers who used to leave motor carriers holding the bag.
Read More →
Long-Awaited Canadian Border Bridge to Open in Detroit
For trucking, the bridge opening should offer immediate improvements in efficiency and reliability, with new customs facilities, expanded inspection capacity, and direct freeway-to-freeway connections.
Read More →
Aurora Rolls Out Next Generation of Driverless Trucks for Commercial Freight
Aurora's latest autonomous trucks it's rolling out with International feature lower-cost hardware designed for a million miles as the company expands commercial driverless freight operations across the U.S. Sun Belt.
Read More →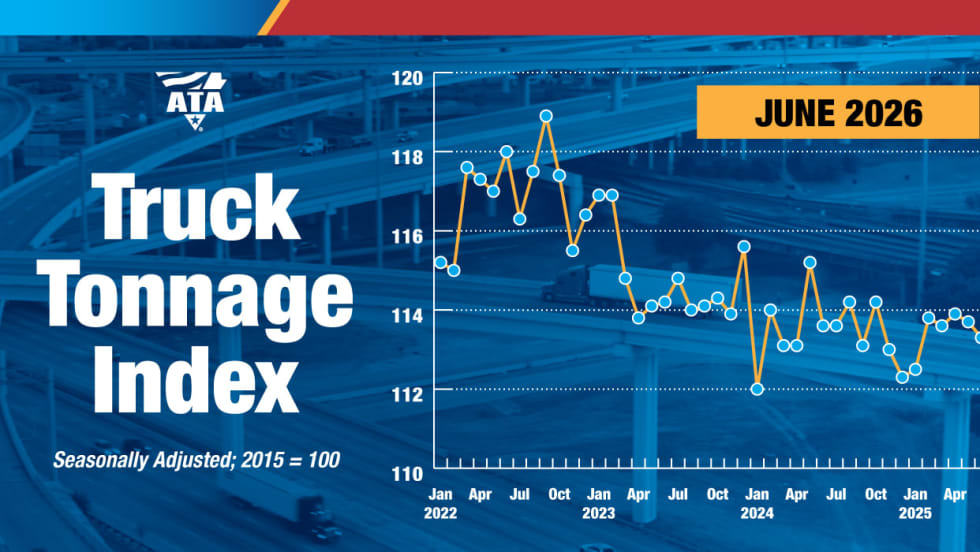
Freight Tonnage Down, Rates up, as Lower Capacity Powers Trucking Recovery
The recovery from the freight recession continues to be driven by reduction in capacity rather than by increased demand.
Read More →
Think Your Trucking Fleet Isn't Using Much AI? Think Again
Shadow AI — the use of unauthorized artificial intelligence tools at work — is becoming increasingly common, putting sensitive company data at risk. Learn how trucking fleets can protect sensitive data while embracing AI.
Read More →
ArcBest Consolidates Brands, Cuts Workforce
The company will bring three business units under the ArcBest brand, eliminate about 2% of positions, and expects the changes to generate $40 million in annual savings.
Read More →
Trucking Fleets Faced Record Operating Costs During Third Year of Freight Recession
ATRI's annual operational cost report shows carriers trimmed fleets, delayed equipment purchases, and ran older trucks as expenses continued to outpace freight rates.
Read More →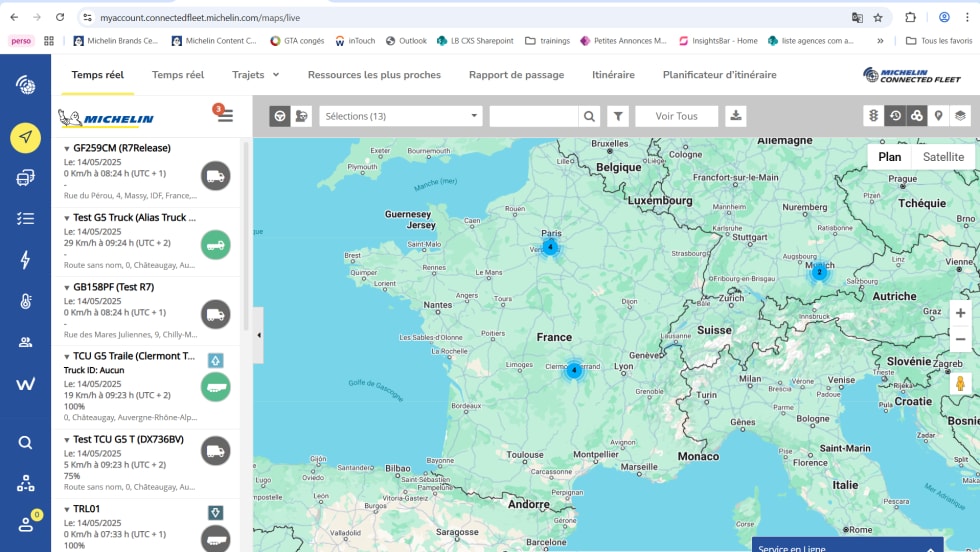
Michelin Adds AI Assistant to MyConnectedFleet Platform
Michelin’s new generative AI tool delivers instant fleet insights, helping managers analyze fuel use, tire maintenance, vehicle status, and operational performance without manually creating reports.
Read More →
LytxOne Platform Now Features AI, Compliance, and Asset Tracking Tools
New enhancements add AI-powered insights, asset tracking, compliance automation, and configurable privacy controls to Lytx's all-in-one fleet management platform.
Read More →