Discerning the meaning of economic data is key to reading the tea leaves about truck freight. In early October, we received a series of weaker-than-expected consumer and industrial data. Whether or not this data proves to be an outlier because of trade concerns and the strike at General Motors remains to be seen.
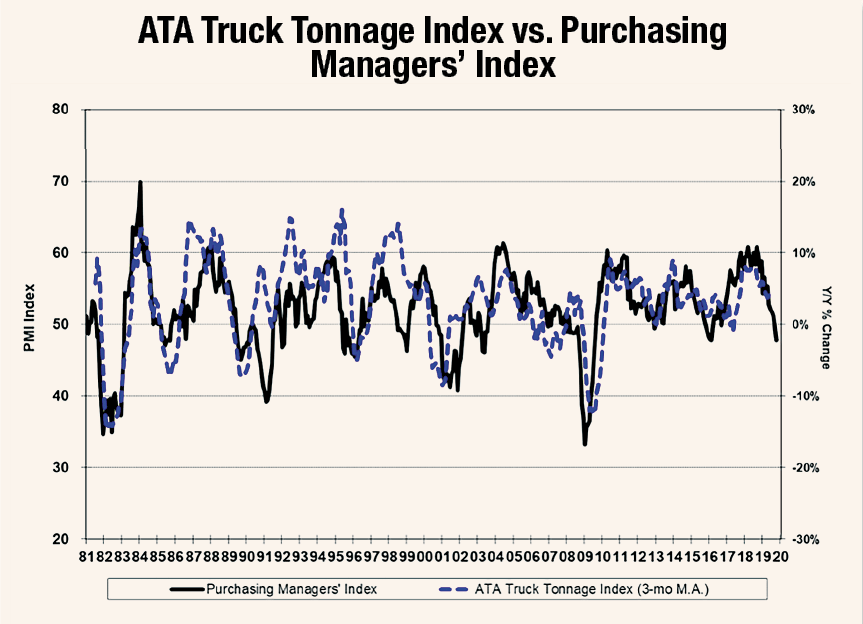
Of particular interest, is the data coming out of the Institute of Supply Management, with respect to its Purchasing Managers Index, which implies weaker fourth-quarter truck tonnage. The PMI has implications for trucking fleets because, historically, this index has had some credible predictive value in terms of forecasting truck tonnage with a two- to three-month lag (see chart).
For those not as familiar with what the PMI tells us, it’s what we call a diffusion index. Its broad quantity of responses is scaled to an index that centers around a figure of 50, which indicates “no change.” The further the index rises above 50, the stronger conditions are, and the further below 50 it drops implies weaker conditions. Strong economies generally read 55 or more, while soft landings are traditionally around 46 to 47, and recessions tend to drive readings of 42 or below.
The PMI asks how purchasing managers report their business across a series of criteria — business output, new orders, inventories, prices paid, and employment. The monthly survey seeks simple answers on whether conditions are better, worse, or the same. The survey is sent out to hundreds of executives in charge of purchasing decisions for public and private companies across all sectors of the economy. The manufacturing-related survey results are released on the first work day of each month, with the non-manufacturing results released a couple days later. We like this index also because it is timely and relevant.
The overall ISM PMI for September was 47.8, below the reading of 50.1 that many economists were expecting and the second consecutive reading below 50. And it marked the weakest reading since June 2009. Looking at other aspects of the survey, the production figure fell 2.2 points to 47.3, and the employment measure declined by 1.1 points to 46.3, implying weaker employment and weaker production.
The inventory component dropped by 3 points to 46.9, implying contracting inventories (this we viewed positively), and the new orders component came in with a weak figure of 47.3 (a view of future business levels, so this is negative). The prices paid reading of 49.7 fell by 3.7 points, implying price deflation.
The overall takeaway: Weakening business confidence. Of the 18 industry segments monitored, only three showed gains: miscellaneous manufacturing; food, beverage and tobacco products; and chemical products.
The non-manufacturing PMI registered a 52.6 – positive overall. However, this was a material slowdown from the reading of 56.4 in August, and well below the expectations for a 55.3 reading. This implies that the weak manufacturing sector report could be spilling over into the service side of our economy. ISM officials cited concerns about trade and tariffs, labor availability, and the general direction of the economy.
Our net takeaway is that this weaker data is consistent with other reports we have been watching. But the magnitude of surprise in September should be noted and monitored, as this index has been one of the more reliable in forecasting truck tonnage and it now implies a continuation of weaker tonnage figures into year’s end.
Jeff Kauffman has been a recognized transportation authority for almost 30 years, most notably heading freight transportation research for Merrill Lynch. Currently he is managing director for Loop Capital Markets and also heads Tahoe Ventures, a transportation consulting company. He can be reached at jkauffman@truckinginfo.com.


