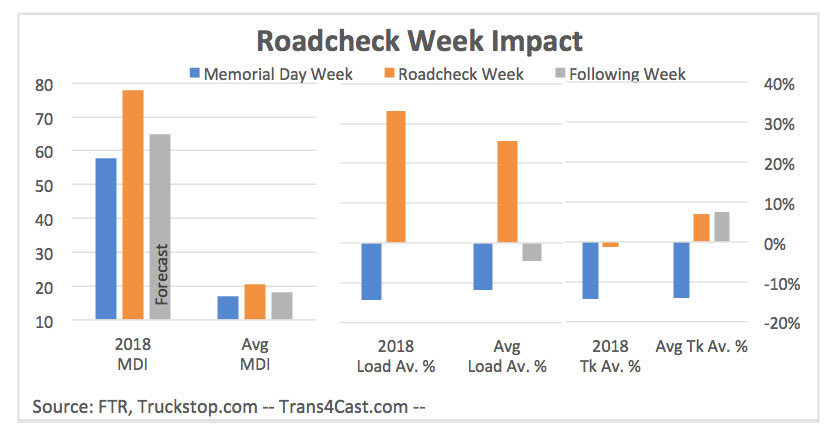
The spot market was the tightest ever – by far – during week 23 of 2018. The ratio of loads available to trucks available in the Truckstop.com system, called the Market Demand Index (MDI), was 77.7 to 1. The previous high was 61.9 in week 14. To put these numbers in perspective, the five-year average is 23.81 for week 23 and 17.51 for week 14. So the imbalance in the spot market is more than three times the usual imbalance.
Although market conditions are driving the degree of imbalance, there’s something else behind the timing of the peak. Barring extreme situations – usually severe weather events affecting a large swath of the country, such as last year’s hurricanes – the MDI peaks each year either in week 23 or week 22.
The answer is actually quite simple: The Commercial Vehicle Safety Alliance’s International Roadcheck, the annual three-day push during which North American commercial vehicle inspectors conduct intensive 37-step Level 1 inspections on drivers and vehicles. International Roadcheck always is announced in advance, and it always occurs during early June. This year’s International Roadcheck occurred June 5-7 – during week 23.
What does International Roadcheck have to do with the spot market? Many drivers would rather not drive during International Roadcheck, so they take a vacation, disrupting capacity temporarily. The impact of this year’s event might have been larger than usual. Because of the focus on hours-of-service compliance, including the now-mandatory electronic logging devices, non-compliant drivers and carriers likely were especially hesitant to operate June 5-7.
How does all of this play out in spot-market terms? Typically, we can look at load availability to understand how freight demand is performing and truck availability to understand how capacity is performing. However, International Roadcheck is one of the handful of times this dynamic does not hold true. Because so many for-hire and private fleet drivers take time off that week, shippers must turn to the spot market in unusually large numbers to find trucks to move their freight. So we get a double whammy of fewer trucks available and more shippers posting loads at the very same time. Adding to the week-to-week impact is the fact that the International Roadcheck week represents the beginning of the summer peak season while also coming off a holiday-shortened week.
This year, we saw what we expected in terms of an increase in posted loads, which were up 33% from the prior week. Over the past four years, that increase has averaged 32% during International Roadcheck week. The average increase over the past 10 years was 26%. Of course, the spot market generally this year is much hotter than usual, so on an absolute basis we had the biggest weekly gain in volumes for a Roadcheck week – an increase of 662,000 posted loads.
However, the real impact this year came from the truck capacity side. The calendar artificially inflates the weekly capacity change because Memorial Day typically reduces capacity by about 14%, which is exactly what we saw in week 22 of this year. The week after Memorial Day we typically see a small but notable uptick on truck capacity. It’s the beginning of summer, so the overall level of capacity does generally stay lower until after the Fourth of July holiday.
This year, not only was there no truck capacity increase, but capacity actually declined further – something FTR hasn’t seen in its 10 years of tracking the spot market. The only time we can compare this to is 2014, when truck availability was unchanged during Roadcheck week compared to the prior week. As in 2014, we have a strong market, combined with a regulatory change that hurts driver productivity – at that time, it was the hours of service changes with the controversial more restrictive 34-hour restart. Over the last 10 years we have averaged an increase in truck availability of 7%. This year we saw a decline of 1%.


