

Fleet Breakdown Frequency Improving; Parts, Labor Costs Increasing
Two benchmarking reports show fleets are running more miles between breakdowns or unscheduled repairs, while the cost of parts and labor for those repairs is up.

The greatest disparity between the vertical average and best-in-class fleet was the tank vertical.
Credit: FleetNet America
Two new benchmarking reports show fleets are running more miles between breakdowns or unscheduled repairs, while the cost of parts and labor for those repairs is up. The reports were released during the American Trucking Associations' Technology & Maintenance Council meeting in Cleveland, Ohio.
Fleets participating in the TMC/FleetNet America Vertical Benchmarking Program managed to put more miles behind them between breakdowns. The survey found that during the first quarter of 2021, fleets averaged 31,638 miles of operation between unscheduled road repairs – up 7.2% from 29,506 in the first quarter of 2020.
Those same groups also saw gains in mileage between breakdowns in the second quarter 2021 compared to the first quarter.
Truckload carriers averaged 23,769 miles between breakdowns, an 8.8% increase in miles from the previous quarter. The time between breakdowns for LTL carriers increased to 46,186 miles in the second quarter from 44,380 in the first quarter of 2021. The tank sector saw a smaller improvement, running 18,241 miles in the second quarter, up from 17,420 in the previous quarter.
Top 5 causes of roadside repairs in Q2 2021 — accounting for 70% of all breakdowns — were tires; brakes, power plant; lighting; cranking, says Paul Gildenhorn. Sharing latest data from @TMC4Trucks / @FleetNetAmerica’s Vertical Benchmarking Report. #TMCFall21pic.twitter.com/sOQebP1f4F
— Vesna Brajkovic (@VesnaBrajk) September 12, 2021
While all three sectors saw improvements, it’s useful to look at the performance of the best-in-class fleets compared to the average for each vertical. The greatest disparity between the vertical average and best-in-class fleet was the tank vertical.
The best-in-class tank fleet ran 35,838 miles between breakdowns, or 105% more than the vertical average of 17,420 miles.
The top-performing truckload fleet beat the vertical average by 89% (41,417 compared to 21,856), and the LTL vertical’s top performer had a 17% edge over the average (51,952 compared to 44,380).
“The data tells us that if, for example, the truckload carriers running the average miles between breakdowns could reach best-in-class performance, they would increase their miles between breakdowns by 64%,” said Emily Hurst, manager of data and analytics at FleetNet America. “That would result in overall lower costs.”
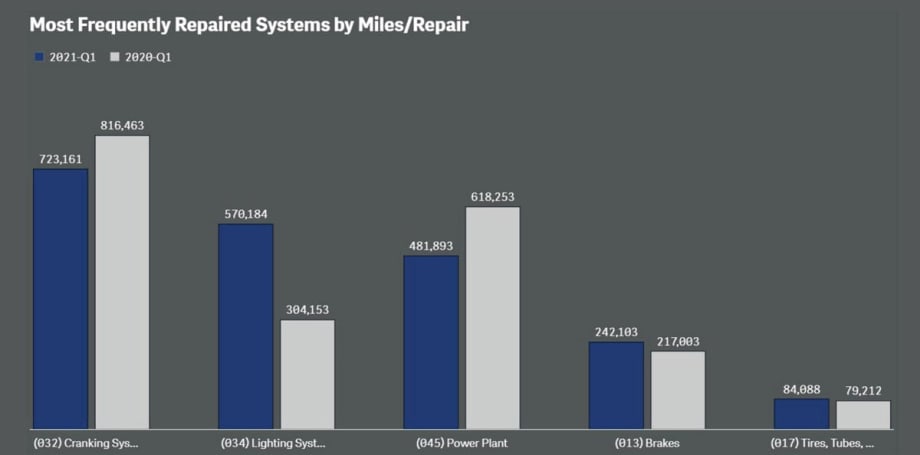
Top 5 Breakdown Triggers
Items from the five most frequently repaired VMRS (Vehicle Maintenance Reporting System) systems accounted for 66% of the breakdown and unscheduled repairs reported by participating fleets. Lighting-related repairs produced the greatest gain, driven by the truckload cohort, which realized a significant improvement over the first quarter last year – 384,000 reported instances in the first quarter of this year, compared to 304,000 last year.
The miles run between cranking system repairs dropped 11.4% when compared to the first quarter of 2020 (816,000 compared to 723,000), meaning participating fleets experienced more cranking system repairs this year than last. Powerplant repairs dropped 22% when compared to the first quarter of 2020 (482,000 vs. 618,000).
Rounding out the top five, brakes and tires/tubes were responsible for the lowest overall numbers of breakdowns and were virtually unchanged from last year.
“Fleets are most likely to realize a better return on maintenance time invested by focusing on these five VMRS systems,” the survey notes.
Parts and Labor
Meanwhile, labor costs for repair and maintenance rose 2.6% between the first and second quarters in 2021 and overall parts costs increased by 2.8%. In that same period, parts costs for tires increased by 10.7% and transmission part costs rose 9%, according to the Decisiv/TMC North American Service Event Benchmark Report.
“The increases in costs for parts and labor reflect the changes taking place in the North American economy,” said Dick Hyatt, Decisiv president and CEO. “Ongoing economic growth has led to a rise in freight volume and demand for carrying capacity. That is also being driven higher by the need to replenish supply chains that have been depleted due to manufacturing and distribution shutdowns during the pandemic.”
Focusing on parts and labor pricing year over year revealed that the three most significant changes between the second quarter of 2020 and the second quarter of 2021 were:
lighting systems (up 17.4%)
transmissions costs rose ( up 16.4%)
brake costs (up 11.1%)
The report covers power unit parts and labor costs in the nine top VMRS level code categories, including brakes, steering, tires, transmissions, electrical, charging, lighting, exhaust and engines.
About the TMC Benchmarking Reports
The Decisiv/TMC North American Service Event Benchmark reports are made possible because of the rapidly growing amount of data being collected on service and repair events for the more than 7 million commercial assets operating across the U.S. and Canada that are being serviced on Decisiv’s SRM platform. The summaries are compiled from more than 600,000 monthly service maintenance and repair operations conducted across nearly 5,000 service locations.
The monthly benchmark reports provide a detailed profile of service costs monthly, quarterly and annually, and on a regional basis. The partnership between Decisiv and TMC to produce the North American Service Event Benchmark reports was announced earlier this year.
TMC fleet members will receive the report electronically via email.
The TMC/FleetNet Vertical Benchmarking Program is a strategic collaboration between TMC/ATA and FleetNet America and is open to TMC fleet executive level members and FleetNet customers. The analytics provided via the program will be cumulative and non-fleet specific.
In addition to the executive summary, which is available to TMC members, fleets that participate by sharing their data are provided an analytic tool that allows them to drill into their data, comparing it to the industry average.
More Maintenance
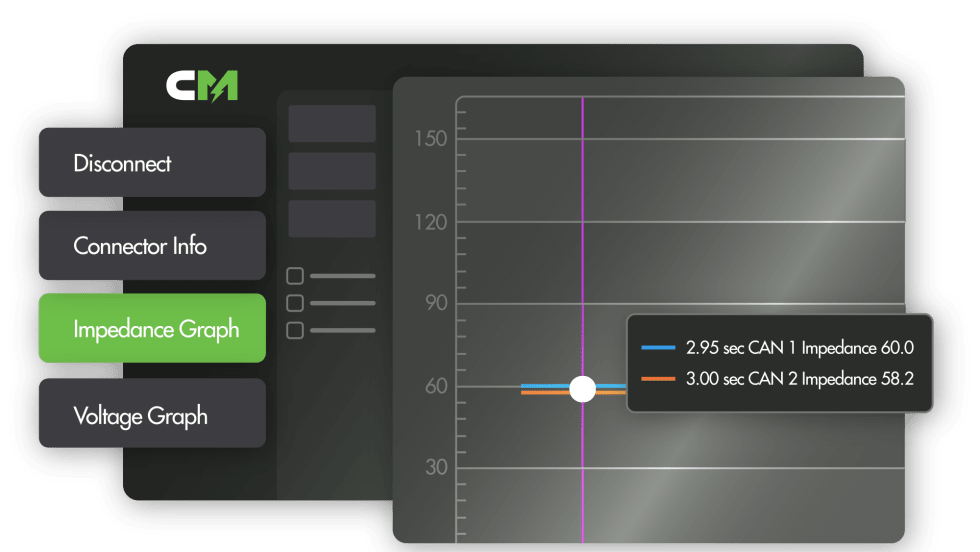
Noregon Launches CAN Mentor to Simplify Vehicle Network Diagnostics
New Noregon software helps technicians identify CAN network issues without requiring advanced diagnostic equipment or specialized training.
Read More →
Maintenance in the Messy Middle Part 4: Renewable Natural Gas
The keys to running renewable natural gas as a fleet fuel depend on specialized technician training, rigorous inspection schedules and an understanding of high-pressure fuel systems.
Read More →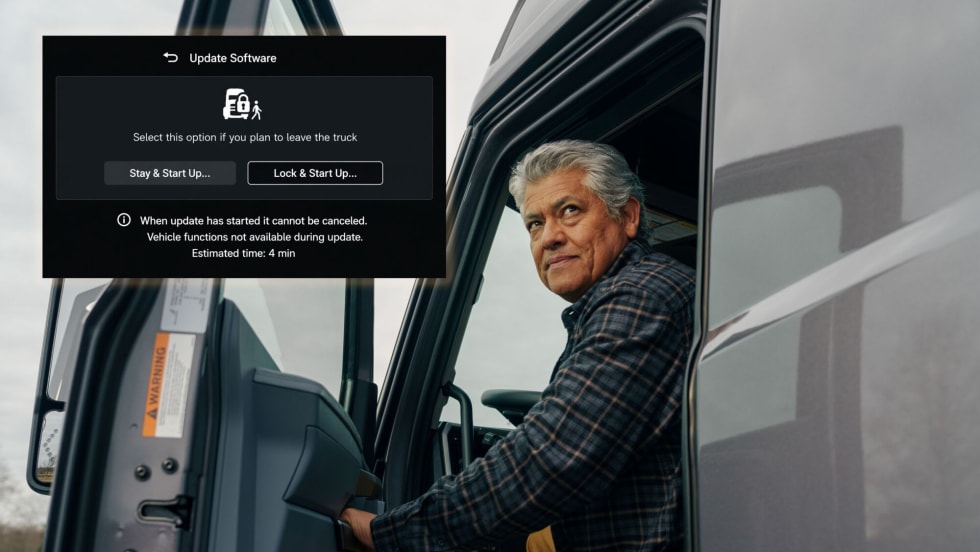
Mack Adds 'Lock & Leave' Feature to Simplify Over-the-Air Software Updates
Mack’s new OTA enhancement allows drivers to start eligible software updates, lock the truck and walk away.
Read More →
Maintenance in the Messy Middle Part 3: Biodiesel
Biodiesel can reduce emissions, improve fuel-system lubricity and use existing diesel infrastructure. But NACFE’s Messy Middle maintenance report says fleets must actively manage storage, cold-weather operation, filters and oil drain intervals to avoid problems.
Read More →
Rush Expands Gulf Coast Peterbilt Network With Louisiana Acquisition
The expanded Rush network gives fleets additional sales, service, leasing and collision repair support across Louisiana's major trucking markets.
Read More →
Is Your Parts Procurement Process Reactive or Proactive?
Ready to revamp your parts procurement process? Learn how now with “Strategic Parts Purchasing: A Process Checklist”
Read More →
Maintenance in the ‘Messy Middle’ Part 2: Renewable Diesel Fuel
NACFE's latest Messy Middle Powertrain Service & Maintenance report says renewable diesel gives fleets an opportunity to reduce carbon emissions without changing trucks, fueling infrastructure or maintenance practices. But technicians still need to understand several important operational differences.
Read More →
The Diesel Engine Enters NACFE’s ‘Messy Middle’
NACFE’s new Messy Middle Powertrain Service & Maintenance report says keeping modern diesel engines running now depends as much on software, diagnostics and data as traditional mechanical service.
Read More →
Wabash Trailers Recalled for Improperly Installed Underride Guards
More than 900 Wabash dry van trailers may not comply with the Federal Motor Vehicle Safety Standard for rear impact guards.
Read More →
DTNA Software Update Gives Truckers More Time Before DEF Derates Take Effect
The changes reflect EPA guidance aimed at reducing downtime caused by emissions-system faults while maintaining compliance requirements.
Read More →