

U.S. NAFTA Surface Trade Increased in 2013, Trucking’s Share Dips
A new U.S. Transportation Department repot shows three of the five surface transportation modes, truck, rail and pipeline, carried more U.S. trade with North American Free Trade Agreement partners Canada and Mexico by value in 2013 than compared to the year before.
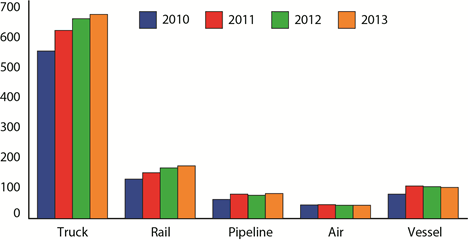
U.S.-NAFTA Merchandise Trade by Mode: 2010-2013. Graphic: U.S. DOT
A new U.S. Transportation Department repot shows three of the five surface transportation modes, truck, rail and pipeline, carried more U.S. trade with North American Free Trade Agreement partners Canada and Mexico by value in 2013 than compared to the year before.
Trade by pipeline also grew the most from year-to-year, 7.7%, partly due to the value of petroleum products, as the overall value on all modes rose 2.6%. Smaller increases took place on rail, advancing 4.6%, and truck increasing 2.2%, while vessel trade fell for the second consecutive year, losing 2.4% and air trade declined for the third straight year, falling 1%.
Most U.S.-NAFTA trade in 2013, 82.4%, was carried on the surface modes of truck, rail and pipeline. Trucks carried 59.7%, followed by rail at 15.4%, air at 9.1%, pipeline at 7.3% and vessel at 3.8%

Although truck carried more than half of U.S.-NAFTA trade last year, its share of total trade has dropped by 4 percentage points from 2004, the first year of DOT data for all modes, while the decline was 0.2 percent points in 2013 compared to 2012. Vessel’s percentage share rose 2.6 points while pipeline rose 1.9 points.
Trade with Canada
Most U.S.-Canada trade in 2013, 83.6%, was carried on the surface modes of truck, rail and pipeline. Trucks carried 54.4%, followed by rail at 16.7%, pipeline at 12.6%, vessel at 5.7% and air at 4.5%.
From 2012 to 2013, total U.S.-Canada trade rose 2.6 %. Freight on two modes, vessel and pipeline grew faster than overall trade, increasing 13% and 7.7%, respectively. Rail and air each gained 2.3%, while truck grew slower, increasing just 0.7%
Although truck carried more than half of U.S.-Canada trade last year, 54.4%, its share of total trade has dropped by 6 percentage points from 2004, the first year of DOT data for all modes, while it fell 1.1 percentage points from 2012.
Truck’s share of imports declined 9.6 percentage points from 51.9% to 42.3%. Pipeline’s share of total trade rose 3.9 points while vessel rose 2.6 points.
Michigan led all states in trade with Canada in 2013 with $74.6 billion. Of the top 10 states for U.S.-Canada trade in 2013, Washington had the highest percent change over 2012, a 6.4% increase.
The top commodity category transported between the U.S. and Canada in 2013 was mineral fuels, valued at $134.1 billion, with $79.2 billion or 59.1% moved by pipelines. The next highest commodity category transported by a single mode in U.S.-Canada trade was vehicles and vehicle parts (other than railway vehicles and parts) with $66.1 billion in trade moved by trucks.
Trade with Mexico
Most U.S.-Mexico trade in 2013, 80.8%, was carried on the surface modes of truck, rail and pipeline. Trucks carried 66.2%, followed by rail at 13.8%, vessel at 13.3%, air at 3% and pipeline at 0.8 %
From 2012 to 2013, total U.S.-Mexico trade rose 2.6%. Freight on three modes, pipeline at 8.5%, rail at 8.2% and truck by 3.8%, grew faster than overall trade. Vessel fell by 9.1% and air declined 6.9%.
Truck carried two-thirds of U.S.-Mexico trade last year, 66.2%. Truck’s share of total trade dropped by 2.9 percentage points from 2004, the first year of DOT data for all modes, but increased 0.8 points from 2012.
Truck’s share of exports declined 5.1 points from 71.6% to 66.6%. Vessel’s percentage share of total trade rose 1.2 points while rail rose 1.1 points. Vessel’s share of exports rose 5.2 points from 6.7% to 12%
Texas led all states in trade with Mexico in 2013 with a value of $195.6 billion. Of the top 10 states for U.S., Mexico trade in 2013, Illinois had the highest percentage change over 2012, a 22.5% increase.
The top commodity transported between the U.S. and Mexico in 2013 was electrical machinery, valued at $94.2 billion, with $85.1 billion or 90.4% moved by trucks. The next highest commodity category transported by a single mode in U.S.-Mexico trade was mineral fuels valued at $50.3 billion in trade moved by vessel.
More Fleet Management
Carrier Transicold Extends Refrigerated Trailer Life
Fleet Refresh enables refrigerated fleets to replace aging transport refrigeration units instead of entire trailers, while adding Lynx Fleet telematics and BluEdge service coverage.
Read More →
FTR Says Freight Rates Surged in May
FTR's Trucking Conditions Index surged to a record high in May, the analytics firm reports.
Read More →
Meet HDT's Truck Fleet Innovators at Heavy Duty Trucking Exchange
Heavy Duty Trucking Exchange brings fleet managers and suppliers together for the deeper conversations that lead to ideas, partnerships, and solutions. Time is running out to apply for HDTX, September 23-25.
Read More →
Enhance Fleet Performance with High-Efficiency Auxiliary Power Units
Drive sustainable cost savings while increasing driver comfort during short- and long-haul logistics operations.
Read More →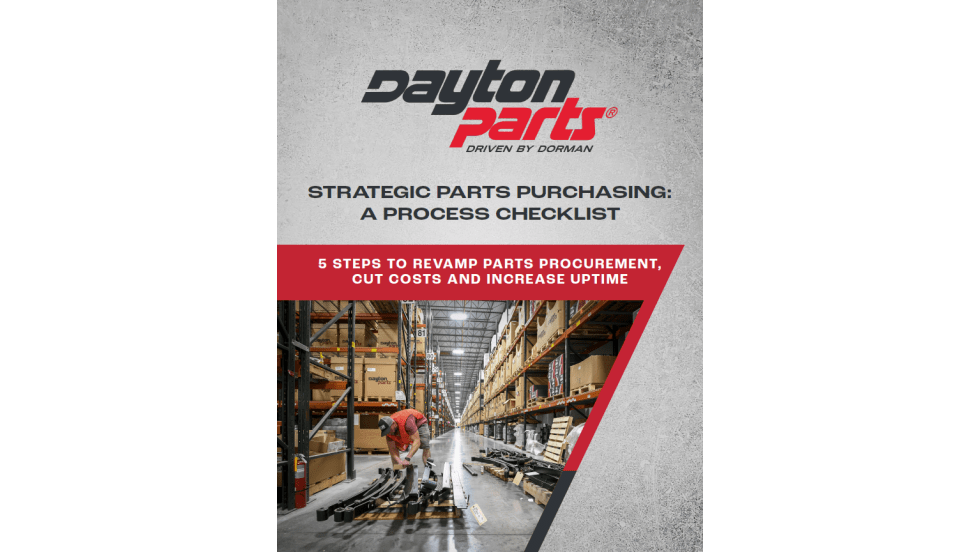
Is Your Parts Procurement Process Reactive or Proactive?
Ready to revamp your parts procurement process? Learn how now with “Strategic Parts Purchasing: A Process Checklist”
Read More →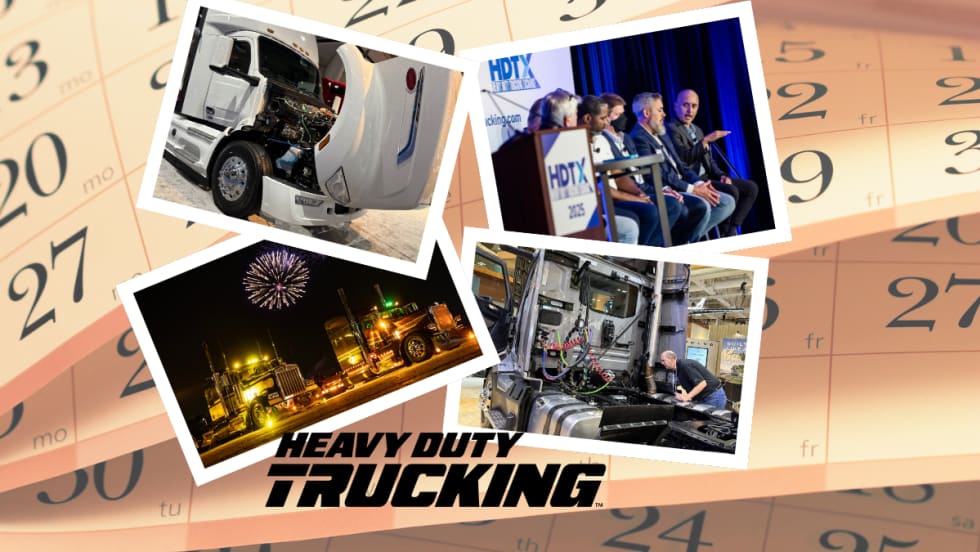
What Trucking Events are Happening in 2026?
Looking for trucking-related conventions, expos, and other events? Heavy Duty Trucking has developed this list of national and larger regional trucking shows and events.
Read More →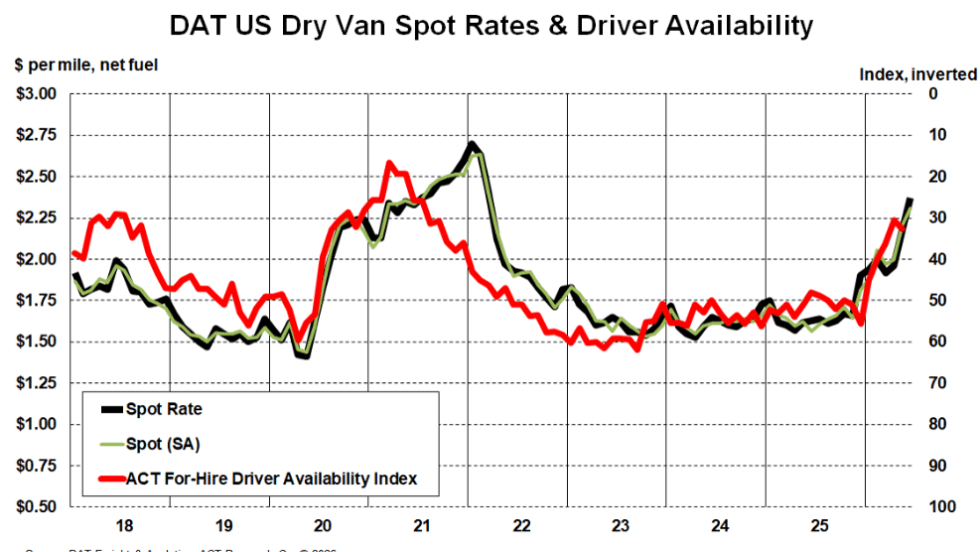
Truckload Rates Keep Rising as Tight Capacity Fuels Freight Market Recovery
Spot and contract rates continued climbing in May and June, not because freight demand is surging, but because fewer trucks and drivers are available.
Read More →
What Geotab's New AI Connector Means for Fleets
Fleets can now ask their usual AI assistants questions about maintenance, safety, fuel use, and vehicle performance, using their live Geotab data, and take action on the answers without leaving their preferred AI tool.
Read More →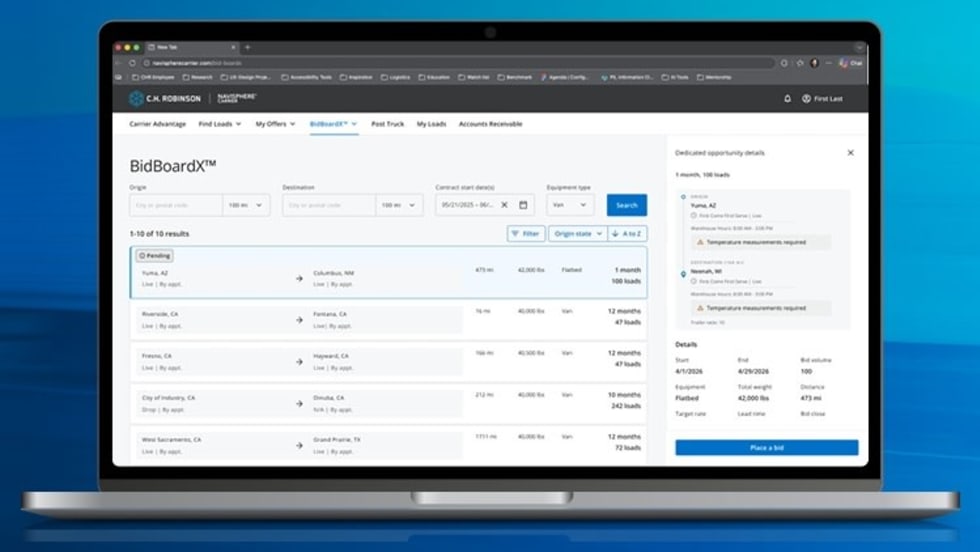
New C.H. Robinson Tool Opens Door to More Predictable Freight
BidBoardX lets carriers search, bid on, and secure committed freight opportunities through a single digital marketplace.
Read More →
New York City's Microhub Project is Delivering Results
Trucking, last-mile delivery companies, and environmental advocates like what they are seeing so far with New York's microhub program.
Read More →