

Gridlock Returns: INRIX National Traffic Scorecard
INRIX, a provider of traffic and navigation services, released its 4th Annual INRIX National Traffic Scorecard revealing gridlock and longer commute times returning to America's roads
INRIX, a provider of traffic and navigation services, released its 4th Annual INRIX National Traffic Scorecard revealing gridlock and longer commute times returning to America's roads.
Traffic congestion increased nationwide for 11 consecutive months in 2010 with drivers experiencing increased traffic congestion nearly every hour of the day. he 150+ page report is available as a free download at http://inrix.com/scorecard/.
"America is back on the road to gridlock," said Bryan Mistele, INRIX president and CEO. "Population growth combined with increases in interstate commerce spurred by economic recovery are fueling these increases. With only 150,000 new jobs created in our nation's urban centers last year, we can expect even worse gridlock when the 6 million jobs lost in the recession return to the nation's cities."
Despite only modest employment gains in 2010, drivers are experiencing an average 10 percent increase in travel times. If unemployment drops to 7 percent by 2012 as economists predict, 9 million more daily work trips will jam our nation's road network, INRIX predicts. Seventy of the 100 most populated cities in the U.S. are experiencing increases in traffic congestion. Nine cities already have surpassed their 2007 peak
After analyzing traffic on major highways in the nation's 100 largest metropolitan areas in 2010, INRIX says the 10 most congested U.S. cities are:
1. Los Angeles: On Thursday at 5:30 p.m., the average trip takes 71 percent longer than normal.
2. New York: On Friday at 5:15 p.m., the average trip takes 47 percent longer than normal.
3. Chicago: On Friday at 5:15 p.m., the average trip takes 41 percent longer than normal.
4. Washington, D.C.: On Thursday at 5:30 p.m., the average trip takes 51 percent longer than normal.
5. Dallas: On Friday at 5:15 p.m., the average trip takes 36 percent longer than normal.
6. San Francisco: On Thursday at 5:30 p.m., the average trip takes 63 percent longer than normal.
7. Houston: On Friday at 5:15 p.m., the average trip takes 33 percent longer than normal.
8. Boston: On Friday at 5:30 p.m., the average trip takes 33 percent longer than normal.
9. Philadelphia: On Friday at 5:15 p.m., the average trip takes 29 percent longer than normal.
10. Seattle: On Thursday at 5:15 p.m., the average trip takes 49 percent longer than normal.
These cities account for more than half of our nation's traffic congestion. New York, San Francisco and Philadelphia experienced increases of almost 20 percent.
Worst Traffic Corridors
Of the 341 traffic corridors of at least 3 miles long that experience heavy traffic congestion every day, the 10 worst were:
1. New York: An 11-mile stretch of I-95 SB (NE Thwy, Bruckner/Cross Bronx Expys) from Conner St to the Hudson Terrace exit that takes 43 minutes on average with 30 minutes of delay.
2. Los Angeles: A 20-mile stretch of the Riverside Fwy/CA-91 EB from the CA-55/Costa Mesa Fwy interchange to the McKinley St. exit that takes 57 minutes on average with 37 minutes of delay.
3. Los Angeles: A 13-mile stretch of the San Diego Fwy/I-405 NB from I-105/Imperial Hwy interchange through the Getty Center Dr. exit that takes 41 minutes on average with 28 minutes of delay.
4. Chicago: A 16-mile stretch of I-90/I-94 EB (Kennedy/Dan Ryan Expys) from the I-294/Tri-State Tollway to the Ruble St. exits that takes 49 minutes on average with 32 minutes of delay.
5. Los Angeles: A 15-mile stretch of the Santa Monica Fwy/I-10 EB from CA-1/Lincoln Blvd. exit to Alameda St. that takes 42 minutes on average with 28 minutes of delay.
6. New York: A 16-mile stretch of the Long Island Expy/I-495 EB from the Maurice Ave. exit to Mineaola Ave./Willis Ave. exit that takes 45 minutes on average with 29 minutes of delay.
7. Los Angeles: A 17.5-mile stretch of I-5 SB (Santa Ana/Golden St Fwys) from E. Cesar Chavez Ave to Valley View Ave. exits that takes 45 minutes on average with 30 minutes of delay.
8. New York: A 10-mile stretch of I-278 WB (Brooklyn Queens/Gowanus Expy) from NY-25A/Northern Blvd. to the NY-27/Prospect Expy. Exits that takes 37 minutes on average with 24 minutes of delay.
9. Pittsburgh: An intense 3-mile stretch of Penn Lincoln Pkwy/I-376 EB from Lydia St. to the US-19 TK RT/PA-51 exit that takes 17 minutes on average with 13 minutes of delay in the morning peak period.
10. Los Angeles: A 13-mile stretch of the San Bernadino Fwy/I-10 EB from City Terrace/Herbert Ave. to Baldwin Park Blvd. that takes 37 minutes on average with 24 minutes of delay.
The Annual INRIX Traffic Scorecard is based on analysis of raw data from INRIX's own historical traffic database generated by the company's Smart Driver Network of more than 4 million vehicles traveling the roads every day including taxis, airport shuttles, service delivery vans, long haul trucks as well as consumer vehicles and mobile devices. Each data report from these GPS-equipped vehicles and devices includes the speed, location and heading of a particular vehicle at a reported date and time.
More Drivers
How Top Trucking Fleets Improve Driver Retention [Video]
What do healthy snacks, optimized routing, and just picking up the phone have in common? They're all strategies the Best Fleets to Drive For are using to retain truck drivers.
Read More →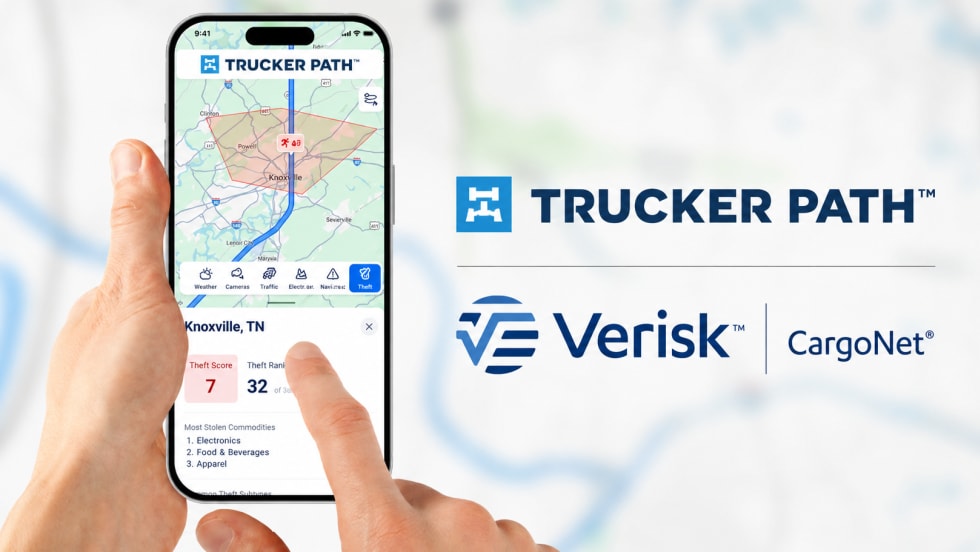
Trucker Path Adds Verisk CargoNet Theft Data to Navigation Platform
Trucker Path’s new cargo theft risk overlays give drivers and fleets visibility into high-risk areas, stolen commodity trends, and theft hotspots.
Read More →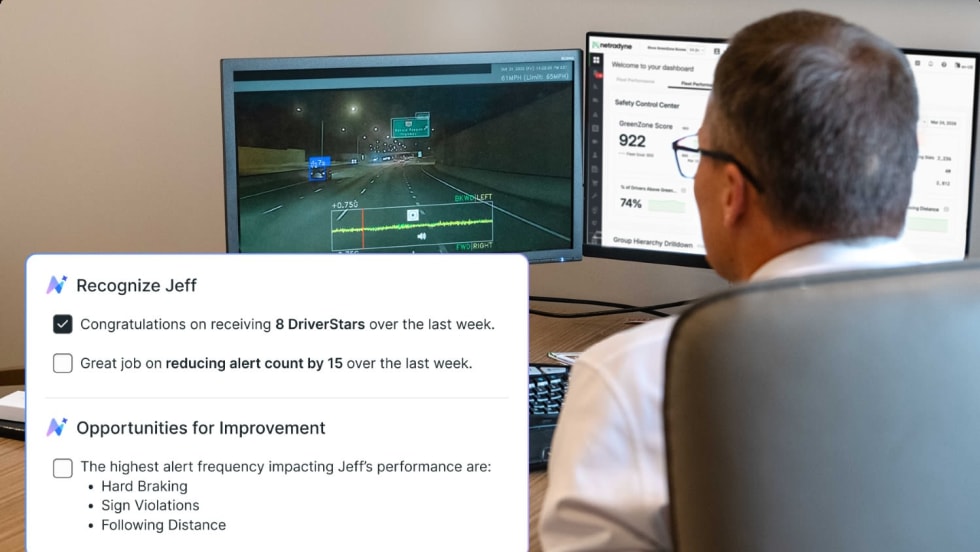
Netradyne Intelligence Uses New AI Agents to Automate Response to In-Cab Camera Data
The company called the next-generation in-cab camera safety platform "a fundamental shift from systems that report on what happened to systems that actively drive what should happen next."
Read More →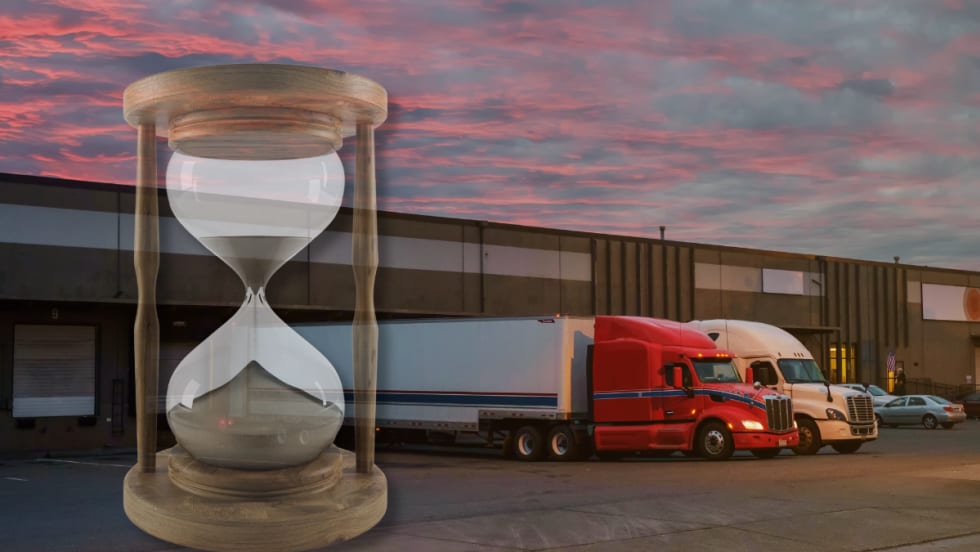
Why Truck Detention Keeps Costing Fleets Time and Money
A 2024 ATRI study found detention affects nearly 40% of truckload stops and costs the industry more than $15 billion annually. Despite the toll on drivers, fleets, and supply chains, the problem remains stubbornly persistent.
Read More →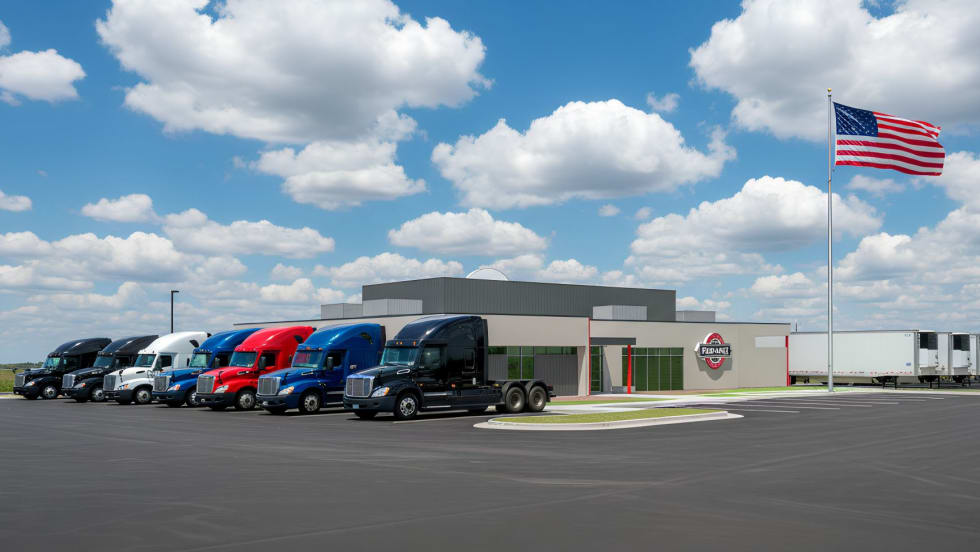
Prime Inc. to Open $7.9M Flagship Used-Truck Dealership
A new driver-focused facility to sell Prime Inc's used trucks and trailers will be the first purpose-built location in the company's history.
Read More →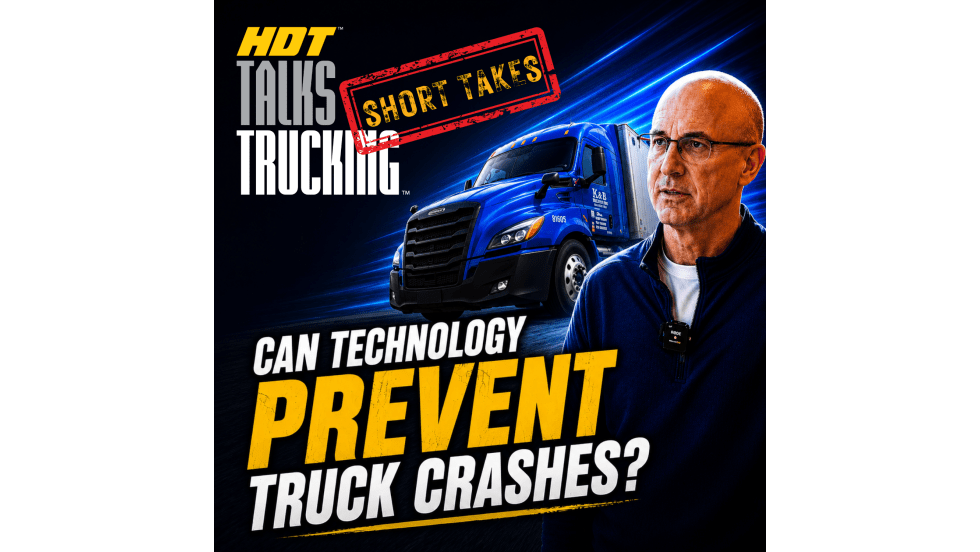
Short Takes: Inside K&B’s Truck Safety Tech
Listen to learn how K&B Transportation uses cellphone-blocking technology, speed management systems, weather geofencing, bridge avoidance tools, and more to improve driver safety.
Read More →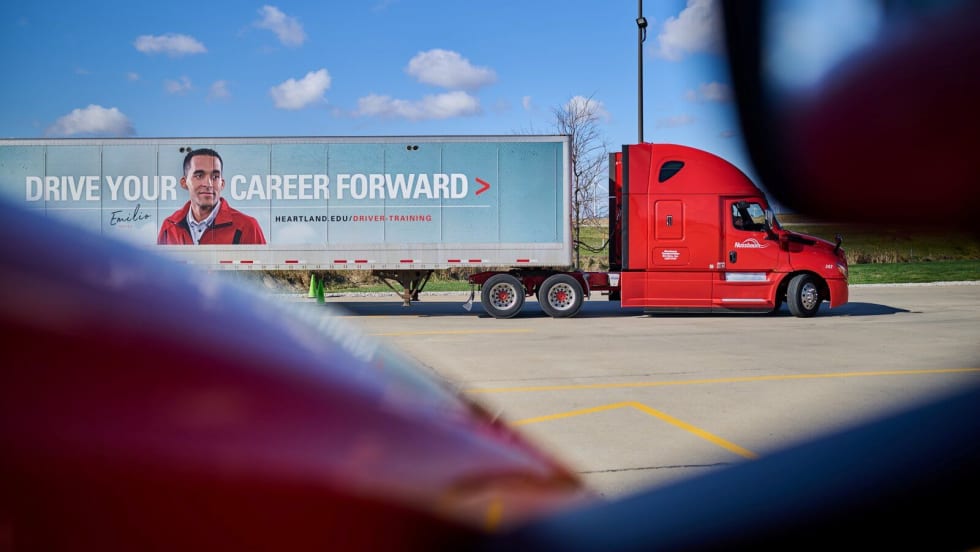
Nussbaum Expands Driver Compensation with Pay Raises, Profit Sharing
Nussbaum Transportation said its latest compensation package could push first-year driver earnings above $90,000 in key hiring markets.
Read More →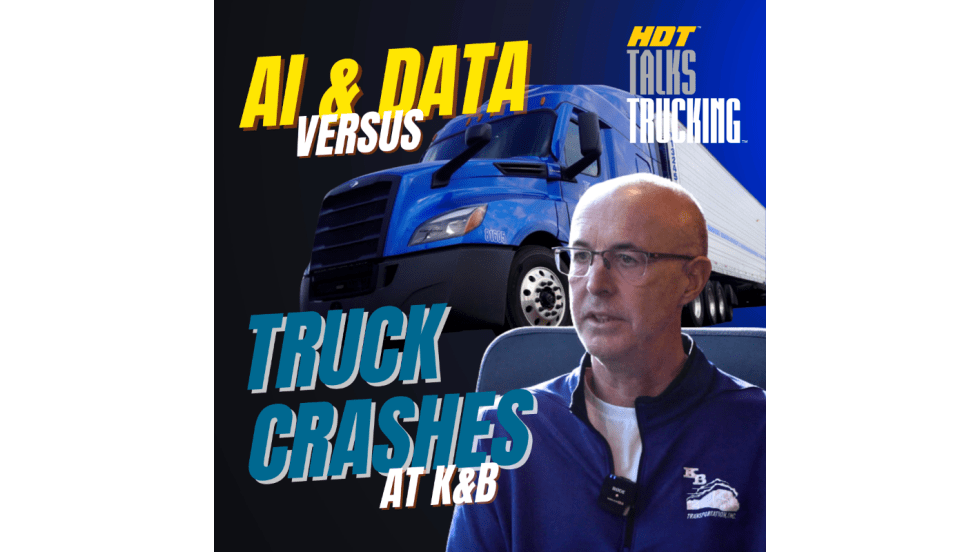
Listen: Inside Modern Fleet Safety: AI, Cameras & Speed Control at K&B Transportation
Fleet safety is evolving fast—and technology is at the center of it. Learn how a former commercial vehicle enforcement officer turned director of safety at K&B Transportation is embracing real-world safety technology.
Read More →
Maverick Announces 2026 Driver Pay Raises
New raises for Maverick Transportation drivers will take effect on May 31, 2026.
Read More →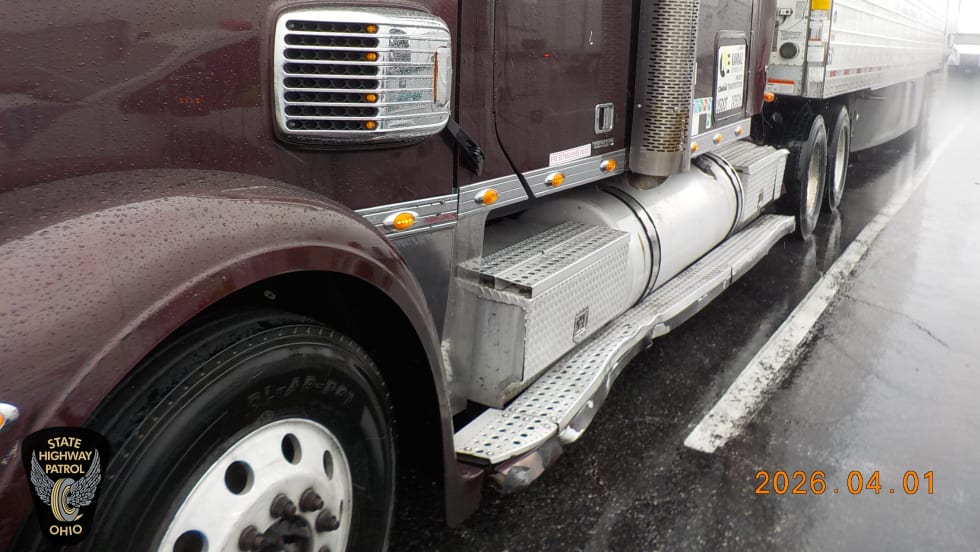
Illinois Trucker Indicted for Nearly $22,000 in Ohio Turnpike Toll Evasion
Authorities say an Illinois trucker avoided paying tolls for two years, and now faces felony charges, possible prison time, and forfeiture of his Freightliner tractor.
Read More →