


Related: Carrier Earnings Worse than the Economy Might Indicate [Commentary]
Where are we headed in 2020? [Commentary]
For the third time this year, the economy seems to be doing better than trucking markets.
January 3, 2020
![Where are we headed in 2020? [Commentary]](https://assets.bobitstudios.com/image/upload/f_auto,q_auto,dpr_auto,c_limit,w_920/businesscycle-roadmap_1768078868492_jdzxse.jpg)
A number of factors could change the direction of our chart in 2020, including trade policy, interest rates, inventory levels, and truck industry regulations.
Source: Tahoe Ventures, LLC Estimates, Federal Reserve, Department of Census
3 min to read
For the third time this year, the economy seems to be doing better than trucking markets. Let’s dig into third-quarter earnings reports from publicly traded fleets for more.
Over the past few months, I have written about declining trends in several areas, including fleet profitability, aggregate industrial production as measured by the data released by the government, and railroad car data, which continues to reflect a negative 5-6% growth rate. What does that mean for 2020? To help answer that, I’m bringing back the Business Cycle (“spaghetti”) chart last seen as we looked ahead to 2019.
In the graphic below, which measured growth rates of industrial production (north/south) and business inventories (east/west), we are currently following along the same track that became the recession of 2001. However, we have to look at where we were, where we are going, and what other activities could impact that direction. What this chart measures is not only direction, but also economic velocity. Generally, north and east is good (positive and accelerating momentum), and south and west is bad (slowing production or inventory liquidation).
We began 2019 at the point marked X3, with about 4-5% industrial production growth, about 6% truck tonnage growth, and about 4-5% inventory growth. Following the thick blue line, you can see that over the course of 2019, we moved almost directly south, only making a turn to the left in the final quarter of the year (point X1). We are now staring at negative industrial production growth rates of 1-2%, and inventories still growing at a 4.5% rate. This is simply not sustainable. Based on past trends, we will continue to see sluggish truck tonnage and industrial production levels until the inventory growth rate is at least in line with overall GDP growth (1.7%-1.9%). This should take at least six months, possibly nine to 12, implying that tonnage/mileage for fleets will likely remain negative until at least mid-year 2020. This puts the market expectations of 1.5%-2% truck freight growth rates in 2020 at risk (point X2).
Now step back and let’s consider some regulatory and geopolitical factors that could change the direction of our chart in 2020: trade policy, interest rates, inventory levels, and truck industry regulations.
Media reports at press time indicated we could be not only on the verge of a Phase One trade deal with China, but we also should get some increased visibility on Brexit and the U.S.-Mexico-Canada Trade Agreement. The passage of, or even increased visibility of, these items could result in businesses deciding they can hold less inventory, and get us to a more balanced inventory/industrial production growth rate quicker. Similarly, many economists believe that there are signs of economic stability in the global economy, and given the strength of the U.S. consumer, the Federal Reserve could move to a more stable position on interest rates, holding at current levels.
The combination of these events should help bring down business inventories at a faster level, but we don’t see inventories getting to proper levels to support freight growth rates in excess of economic growth rates until at least late summer or into fall.
Finally, new regulation may help reduce driver capacity and raise freight rates, including increased use of hair testing, the new federal Drug & Alcohol Clearinghouse, and full implementation of the electronic logging device mandate that went into effect last month. Carrier bankruptcies such as Celadon’s recent closure may further reduce fleet capacity, and more carrier failures are likely, given rising insurance and still-weak spot rates.
While these factors could lead to a stronger rate structure in the industry and improved profits later in 2020, the story for the near term in 2019 and early 2020 will remain, “too many trucks for too little freight.” The result will be declining pricing and increased pressure on carrier profits.
Subscribe to Our Newsletter
More Fleet Management
How Innovative Trucking Leaders Turn Change Into an Advantage
As the pace of change accelerates in trucking, the fleets that adapt best have more than the latest technology. They have cultures that embrace improvement.
Read More →
Freight Broker Bonds Just Got Harder to Get. Here's What That Means for Your Fleet.
When it gets harder for a freight broker to prove they are financially sound, the ones who cannot clear that bar get pushed out of the market. And those are exactly the brokers who used to leave motor carriers holding the bag.
Read More →
Long-Awaited Canadian Border Bridge to Open in Detroit
For trucking, the bridge opening should offer immediate improvements in efficiency and reliability, with new customs facilities, expanded inspection capacity, and direct freeway-to-freeway connections.
Read More →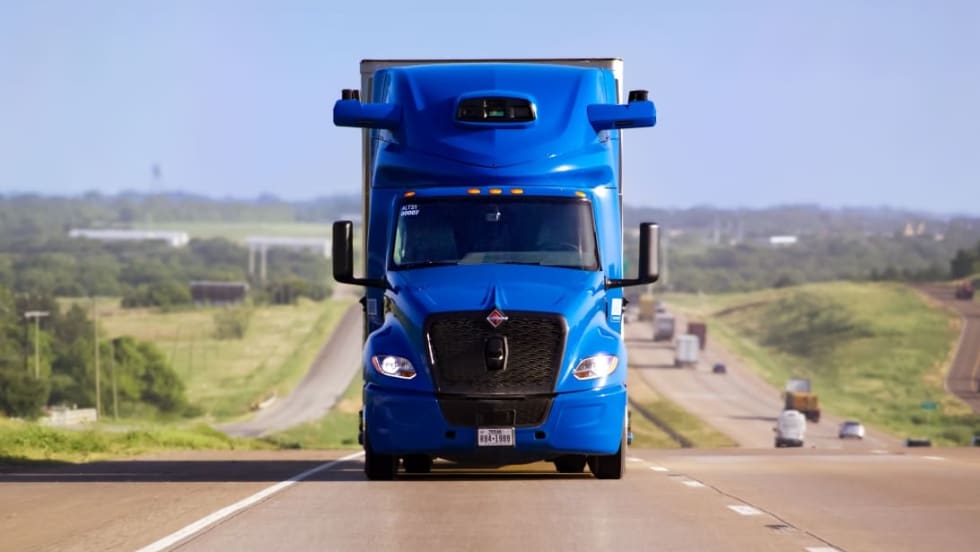
Aurora Rolls Out Next Generation of Driverless Trucks for Commercial Freight
Aurora's latest autonomous trucks it's rolling out with International feature lower-cost hardware designed for a million miles as the company expands commercial driverless freight operations across the U.S. Sun Belt.
Read More →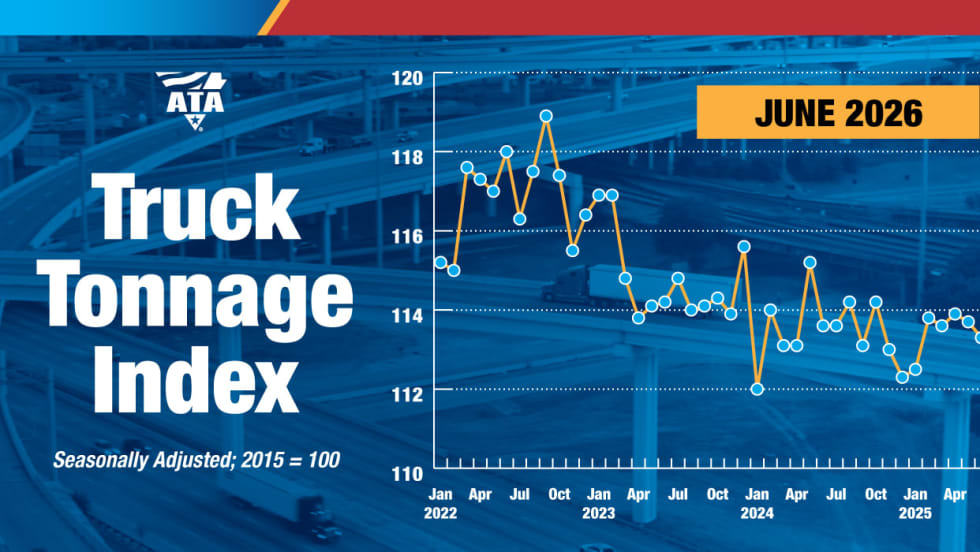
Freight Tonnage Down, Rates up, as Lower Capacity Powers Trucking Recovery
The recovery from the freight recession continues to be driven by reduction in capacity rather than by increased demand.
Read More →
Think Your Trucking Fleet Isn't Using Much AI? Think Again
Shadow AI — the use of unauthorized artificial intelligence tools at work — is becoming increasingly common, putting sensitive company data at risk. Learn how trucking fleets can protect sensitive data while embracing AI.
Read More →
ArcBest Consolidates Brands, Cuts Workforce
The company will bring three business units under the ArcBest brand, eliminate about 2% of positions, and expects the changes to generate $40 million in annual savings.
Read More →
Trucking Fleets Faced Record Operating Costs During Third Year of Freight Recession
ATRI's annual operational cost report shows carriers trimmed fleets, delayed equipment purchases, and ran older trucks as expenses continued to outpace freight rates.
Read More →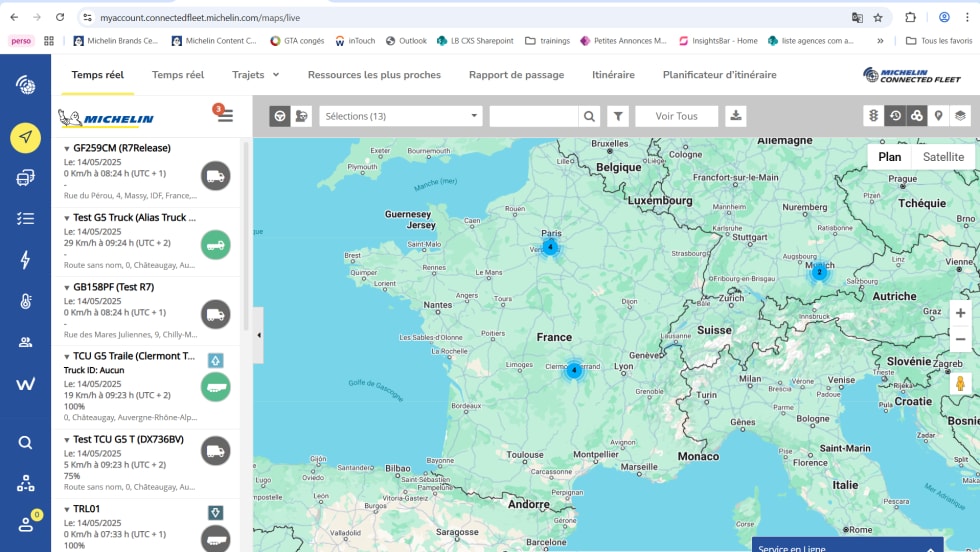
Michelin Adds AI Assistant to MyConnectedFleet Platform
Michelin’s new generative AI tool delivers instant fleet insights, helping managers analyze fuel use, tire maintenance, vehicle status, and operational performance without manually creating reports.
Read More →
LytxOne Platform Now Features AI, Compliance, and Asset Tracking Tools
New enhancements add AI-powered insights, asset tracking, compliance automation, and configurable privacy controls to Lytx's all-in-one fleet management platform.
Read More →