

What Railroad Statistics Can Tell Us About Truck Freight Volumes
Is a broad statistic that can give us a real-time second-level read on the magnitude and direction of freight trends? The answer is rail carloads.

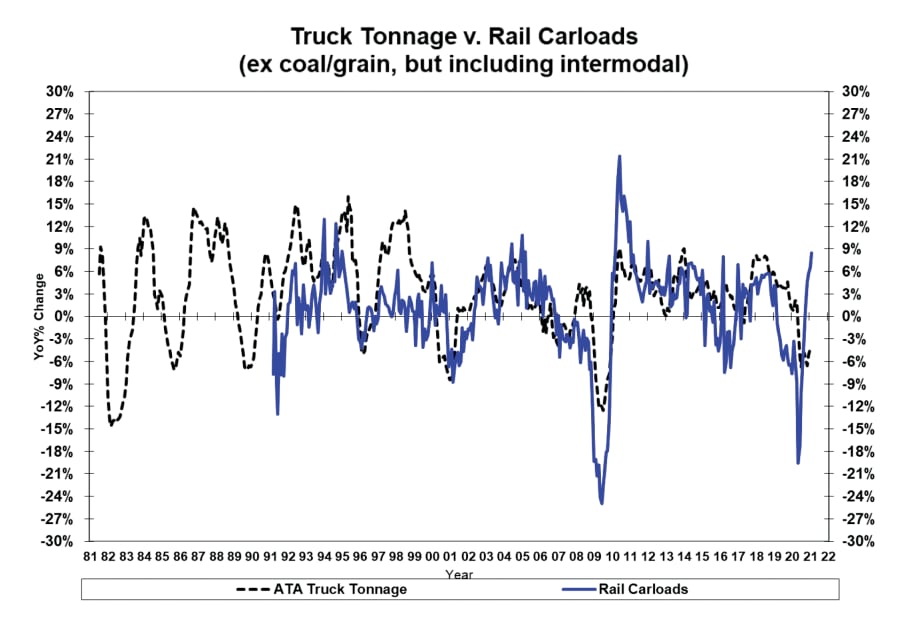
Adjusted rail carload numbers track well with truck tonnage in terms of direction and magnitude. These have a consistent predictive value with industrial production and corporate profits.
Source: AAR and ATA
Many publicly traded fleets were optimistic about growth in 2021 in fourth-quarter earnings calls, noting they expect rate increases ranging from high single digit to low double digits. One carrier even anticipates rate increase percentages in the mid-teens. Many, however, were more evasive.
As of the week ended Feb. 12, we were still seeing about a 12% differential between spot and contract rates, so those rate forecasts could prove to be true – but rates can change quickly. We also are watching to see how new driver pay increases eat into some of those rate increases, as fleets continue to struggle to find drivers.
There are two sides to this equation: demand for freight to be moved, and the ability to supply the equipment to do so. Supply is tight, as we know, but what is cargo demand likely to be?
Despite the slowdown in freight volume that typically occurs after the Christmas holidays, Truckstop.com’s Market Demand Index in mid-February remained at an elevated level of 138, implying a very tight market for spot truck capacity (normal ranges are in the 30-40 band). And during a southern California fly-over, I counted 34 container ships waiting to dock at the ports of Los Angeles/Long Beach. This implies that there is still a healthy backlog of product that has already sailed to the U.S. and needs transportation to end markets. In other words, the markets are likely to continue to be tight over the next couple months as retailers continue to restock.
Having said that, with such strange year-over-year comparisons, how do we think about a reliable cargo forecast for 2021? Trying to forecast truck tonnage or freight demand is a mosaic approach at best, and with improved analytics, the field of potential datapoints has become large indeed.

Jeff Kaufmann
Corporate profits as a data statistic is very important in understanding the business environment. The statistic I like to use (S&P 500 earnings) is easily available and applies to businesses across a broad spectrum of industries. When profits are strong, companies hire more employees, travel, and spend on capital and plant, which drives freight demand. With almost 75% of trucks operated by private fleets and local companies, I believe this general economic statistic tells as good a story as truck-industry-specific profits, and on a more timely basis. Currently, the forecast for S&P 500 profits is +23% on an operating basis. We rarely see growth this strong, so cash will be more readily available.
Is there an equally broad statistic that can give us a real-time second-level read on the magnitude and direction of freight trends? Industrial production is forecasted to grow between 3.5-4%, but this data needs a reliable verification. The answer, in my opinion, is rail carloads. Rail carloads lead GDP movements by an average of three to six months and industrial production by three to four months. And rail carloads are reported weekly by the Association of American Railroads, versus a two-month lag for truck tonnage information.
I prefer to use an “adjusted carload” figure, removing coal and grain carloads, which do not drive substantial truck business and are more subject to weather and currency influences. I add back intermodal carloads, as I believe this helps account for the housing and retail components of the economy.
As you can see on the graph above, these adjusted rail carload numbers track well with truck tonnage in terms of direction and magnitude. These have a consistent predictive value with industrial production and corporate profits. So the implication for freight volume growth for 2021 is continued positive momentum in the upper-single-digit range. This will likely slow in the second half of the year to the mid-single digits.
This commentary originally appeared in the March 2021 print edition of Heavy Duty Trucking.
More Fleet Management

How Innovative Trucking Leaders Turn Change Into an Advantage
As the pace of change accelerates in trucking, the fleets that adapt best have more than the latest technology. They have cultures that embrace improvement.
Read More →
Freight Broker Bonds Just Got Harder to Get. Here's What That Means for Your Fleet.
When it gets harder for a freight broker to prove they are financially sound, the ones who cannot clear that bar get pushed out of the market. And those are exactly the brokers who used to leave motor carriers holding the bag.
Read More →
Long-Awaited Canadian Border Bridge to Open in Detroit
For trucking, the bridge opening should offer immediate improvements in efficiency and reliability, with new customs facilities, expanded inspection capacity, and direct freeway-to-freeway connections.
Read More →
Aurora Rolls Out Next Generation of Driverless Trucks for Commercial Freight
Aurora's latest autonomous trucks it's rolling out with International feature lower-cost hardware designed for a million miles as the company expands commercial driverless freight operations across the U.S. Sun Belt.
Read More →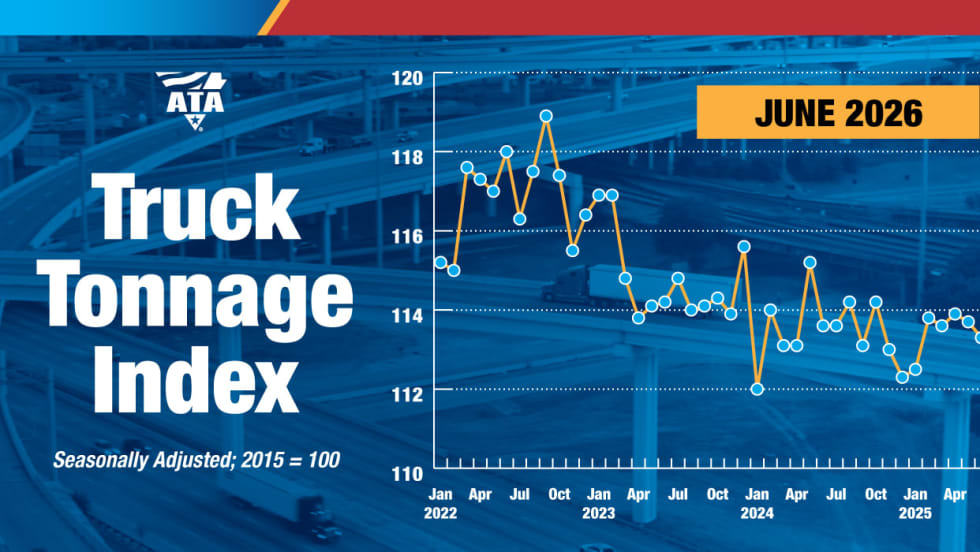
Freight Tonnage Down, Rates up, as Lower Capacity Powers Trucking Recovery
The recovery from the freight recession continues to be driven by reduction in capacity rather than by increased demand.
Read More →
Think Your Trucking Fleet Isn't Using Much AI? Think Again
Shadow AI — the use of unauthorized artificial intelligence tools at work — is becoming increasingly common, putting sensitive company data at risk. Learn how trucking fleets can protect sensitive data while embracing AI.
Read More →
ArcBest Consolidates Brands, Cuts Workforce
The company will bring three business units under the ArcBest brand, eliminate about 2% of positions, and expects the changes to generate $40 million in annual savings.
Read More →
Trucking Fleets Faced Record Operating Costs During Third Year of Freight Recession
ATRI's annual operational cost report shows carriers trimmed fleets, delayed equipment purchases, and ran older trucks as expenses continued to outpace freight rates.
Read More →
Michelin Adds AI Assistant to MyConnectedFleet Platform
Michelin’s new generative AI tool delivers instant fleet insights, helping managers analyze fuel use, tire maintenance, vehicle status, and operational performance without manually creating reports.
Read More →
LytxOne Platform Now Features AI, Compliance, and Asset Tracking Tools
New enhancements add AI-powered insights, asset tracking, compliance automation, and configurable privacy controls to Lytx's all-in-one fleet management platform.
Read More →