2021 HDT Fact Book: Trucking Rides High on Economic Recovery
Despite the challenges of a driver shortage, scrambled supply chains and order backlogs, conditions for making money in trucking have exploded since the lift of spring 2020 COVID-19 pandemic lockdowns. See the data that backs it up from HDT's 2021 Fact Book.
Heavy Duty Trucking’s annual Fact Book issue is designed to provide a snapshot of the current state of the industry, where it’s been, and where it’s going. These numbers can help you in planning and benchmarking your fleet, and in telling trucking’s story to others.
Graphic: HDT
2 min to read
Despite the challenges of a driver shortage, scrambled supply chains, and new-equipment order backlogs — or perhaps in part because of those factors — conditions for making money in trucking have exploded since the lift of spring 2020 COVID-19 pandemic lockdowns.
Ad Loading...
The following graphs paint a picture of excellent trucking conditions and an industry where carriers are in the drivers’ seat when it comes to rates.
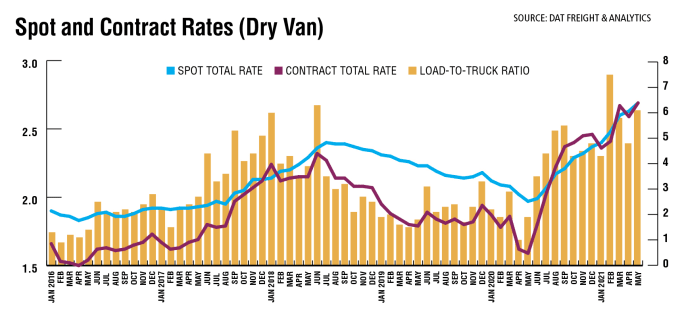
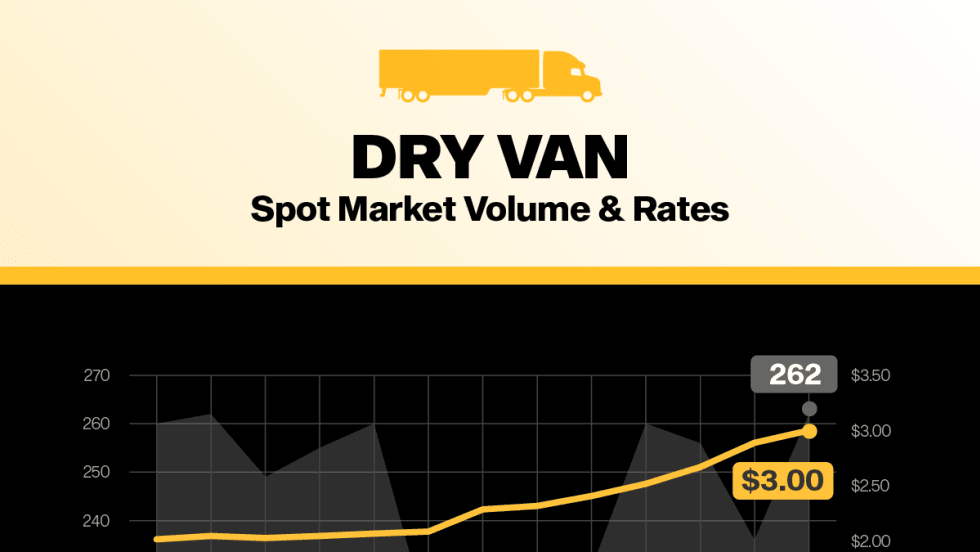
After a year of record spot freight volumes and rates, there are indications that spot and contract freight are starting to come back more into balance.
Ad Loading...
Following the market boom in 2018, the spot freight market balanced out and was averaging 400,000 loads per day and approximately $2/mile, explains Brent Hutto, chief relationship officer with Truckstop.com. “But the pandemic’s effect on the purchasing behavior of the U.S. consumer radically changed everything. Consumer purchasing increased more than 35% above yearly normal in the second half of 2020 and has remained strong into 2021. This change resulted in a market that peaked at 1.8 million loads in a single day and rates of $3.17 per mile.”
There was a peak in spot freight activity in March 2020 as the pandemic hit, a fast decline through the end of April, and a seven-month recovery through the start of January 2021. Rates and ratios fell predictably in January and then spiked again in February when the polar vortex hit so much of the country.
Source: DAT Freight & Analytics
Spot market load volumes and rates are beginning to normalize, Hutto says, but a truly normal spot marketplace is not expected until 2022.
Against that backdrop, it’s been a busy past year for mergers and acquisitions, many of which appear aimed at being able to provide customers with one-stop shopping. Rail company CSX bought Quality Carriers, a bulk liquid chemicals truck transportation business, creating a rail-to-highway offering. Knight-Swift is buying AAA Cooper as a move into the less-than-truckload business. Canada’s TFI International has been on a buying spree both north and south of the border, including UPS’ LTL business and global 3PL DLS Worldwide. And those are just a few examples.
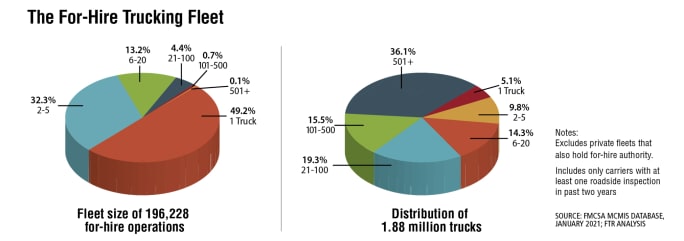
At the same time, the number of new for-hire trucking companies getting authority has soared. The majority appear to be entrepreneurial truck drivers leaving big fleet jobs to start their own businesses, taking advantage of high spot rates and new technology that allows them to more easily book loads.
The largest trucking companies make up a small part of the for-hire industry but own the vast majority of the trucks.
Source: FMCSA MCMIS database, January 2021; FTR Analysis
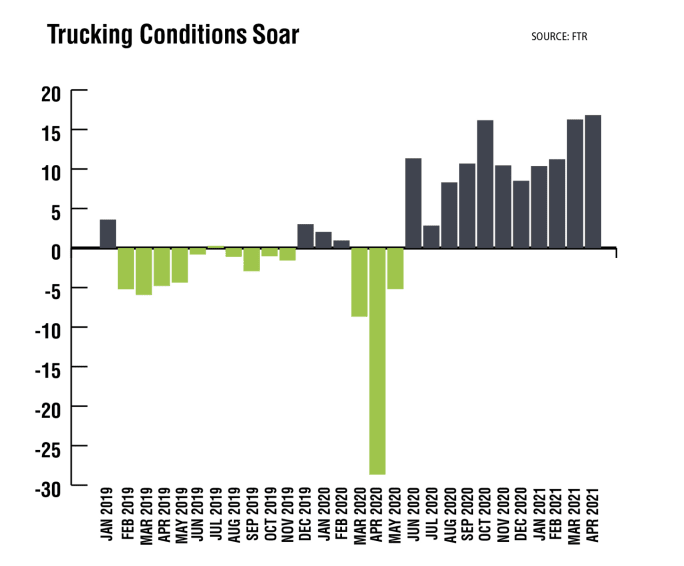
After plummeting during the pandemic lockdown last year, FTR’s Trucking Conditions Index set record highs in March and April, the most recent figures available. The TCI tracks the changes rep-resenting five major conditions in the U.S. truck market: freight volumes, freight rates, fleet capacity, fuel price, and financing. (FTR reported May TCI eased slightly from April's record 16.82 to a still-robust 15.72.)
Source: FTR
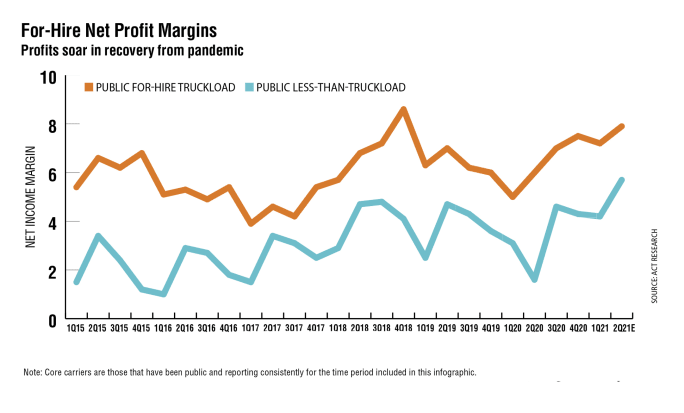
Public for-hire truckload core carrier net profit margin expansion continued to accelerate in the first quarter of 2021, up 2.2 percentage points year over year to 7.2%. Driven by strong freight growth and exacerbated by a shortage of drivers, freight hauling capacity remains in short supply, leading to higher freight rates, which has boosted carrier profit margins. Although freight rates may be at or near peak, as they roll over, they will remain in very healthy territory.
A similar story exists for public for-hire less-than-truckload carriers, whose net profit market of 4.2% in the first quarter was 1.2 percentage points higher than a year earlier. Though not a record, it is well above normal, with expectations for unprecedented further expansion, owing largely to anticipated capital expenditure growth that will disproportionately benefit LTL carriers.
Source: ACT Research
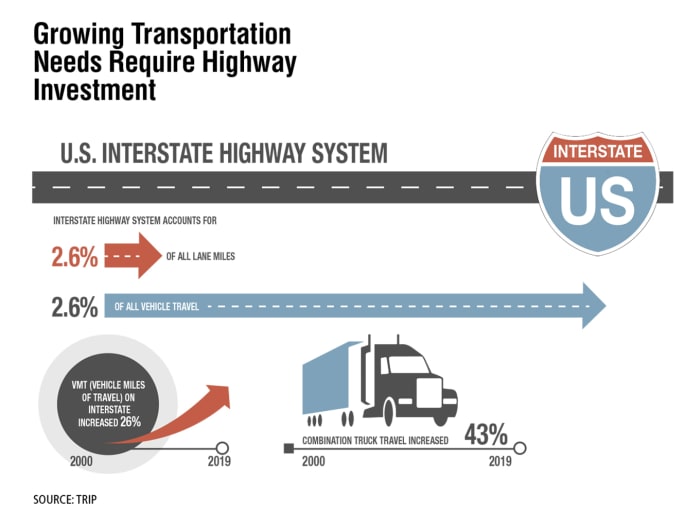
A report released by TRIP found that from 2000 to 2019, travel on the Interstate system has increased 26% — a rate nearly triple that at which new lane capacity was added. The report also found that travel by combination trucks on the Interstate increased at a rate more than double that of overall vehicle travel between 2000 and 2019. The U.S. Interstate Highway System will need to be rebuilt and expanded to meet transportation needs, TRIP officials said.
Source: TRIP
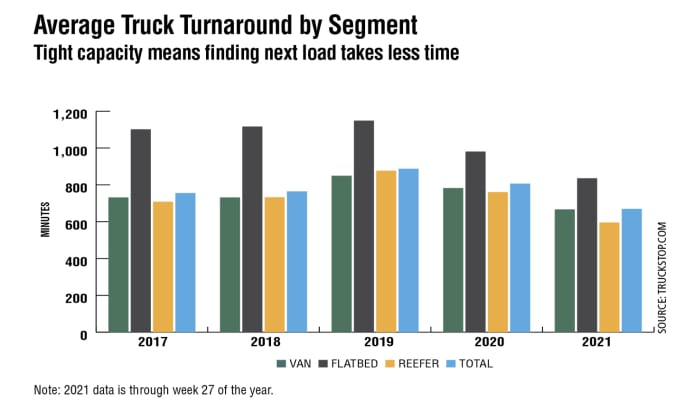
Truck turnaround time data from Truckstop.com measures the time it takes to find a load af-ter offloading at the previous customer. Although 2021 numbers are only through July 11, it’s clear that tight trucking capacity has caused those turnaround numbers to drop, especially in the refrigerated sector, indicating a freight marketplace that heavily favors the carrier. This carrier advantage is being driven by the explosion of load posting volumes in the spot market. At press time, load volumes were more than 100% more than a normal spot market. The truck turnaround time will most likely continue to stay below normal until the spot market returns to balance.
Source: Truckstop.com
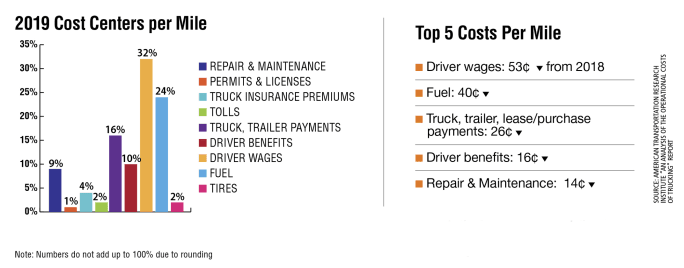
Between 2018 and 2019, the average marginal costs per mile decreased by 9%, according to the American Transportation Research Institute's 2020 report. . Despite this, each cost center percent-age remained fairly constant with little fluctuation year-over-year. The largest single cost for carriers continued to be driver wages, representing 32% of the operating cost per mile (versus 33% in 2018).
Credit:
American Transportation Research Institute “An Analysis of the Operational Costs of Trucking” Report
Trucking is an increasingly data-driven industry. Numbers matter. There’s no end to the available software and analytics available to fleets today to help them analyze and improve their operations.
But sometimes you want to look at statistics and data to help give you the big picture, and this is what Heavy Duty Trucking’s annual Fact Book issue is all about. It’s designed to provide a snapshot of the current state of the industry, where it’s been, and where it’s going. These numbers can help you in planning and benchmarking your fleet, and in telling trucking’s story to others. And it can serve as a reference guide throughout the year.
This is the seventh year for the HDT Fact Book. Check out the other published sections of the Fact Book:
Industry: Trucking Rides High on Economic Recovery
Shadow AI — the use of unauthorized artificial intelligence tools at work — is becoming increasingly common, putting sensitive company data at risk. Learn how trucking fleets can protect sensitive data while embracing AI.
The company will bring three business units under the ArcBest brand, eliminate about 2% of positions, and expects the changes to generate $40 million in annual savings.
ATRI's annual operational cost report shows carriers trimmed fleets, delayed equipment purchases, and ran older trucks as expenses continued to outpace freight rates.
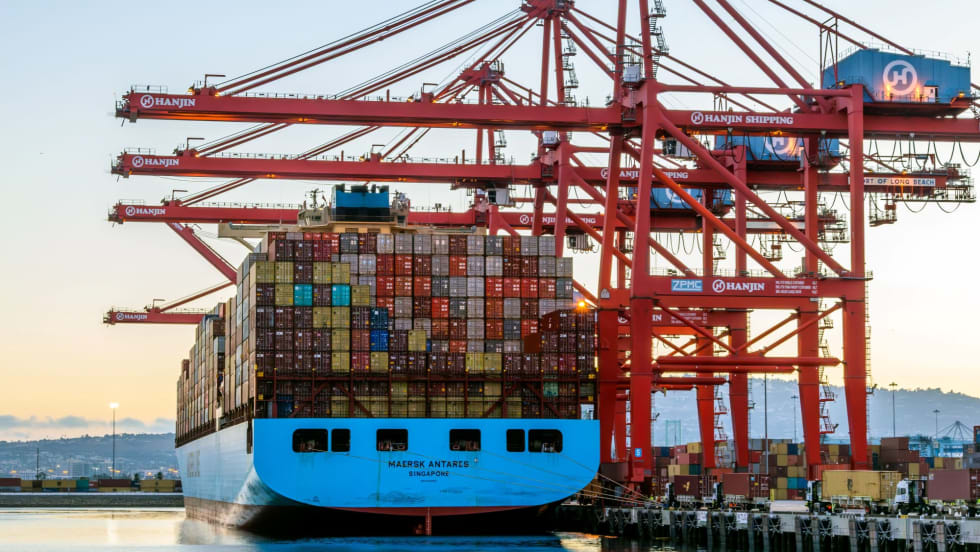
The National Retail Federation projects July container imports will surpass the pandemic-era record as shippers frontload freight ahead of expected August tariff increases.
From AI and fleet electrification to safety, operations, and leadership, these HDT Truck Fleet Innovator finalists are changing how trucking gets done.
Fleet Refresh enables refrigerated fleets to replace aging transport refrigeration units instead of entire trailers, while adding Lynx Fleet telematics and BluEdge service coverage.