HDT Fact Book: Industry

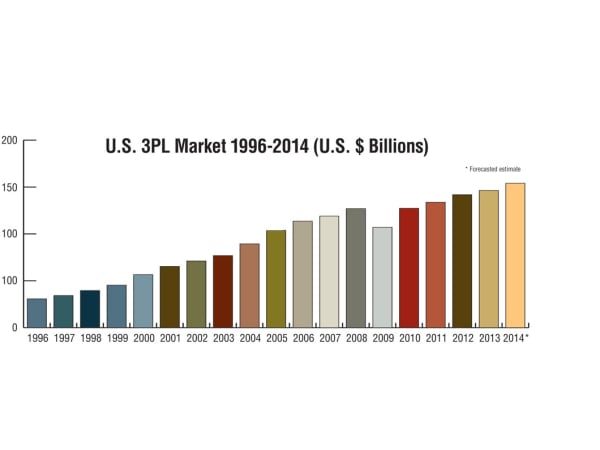
The U.S. third party logistics market gross revenue grew 3.2% from 2012-2013. Armstrong & Associates estimates that growth will be 5.2% for 2014 as the U.S. economy continues to expand. Source: Armstrong & Associates
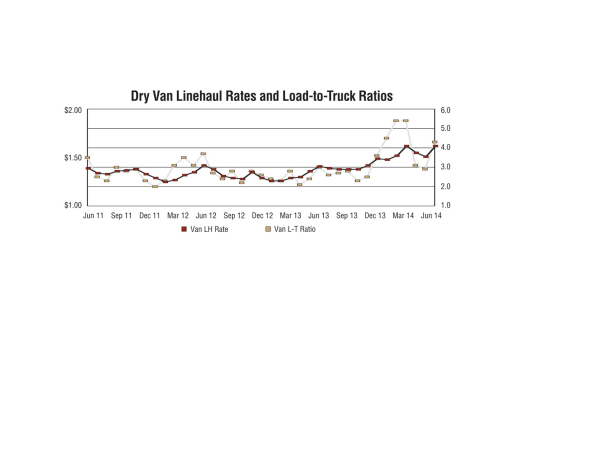
Load-to-truck ratios indicate the available freight (loads) per truck (capacity) on the spot market, as measured in DAT Load Boards. Trends in this ratio typically signal impending changes in spot market rates. Ratios and rates have been elevated for vans on the spot market since January. Source: DAT Solutions
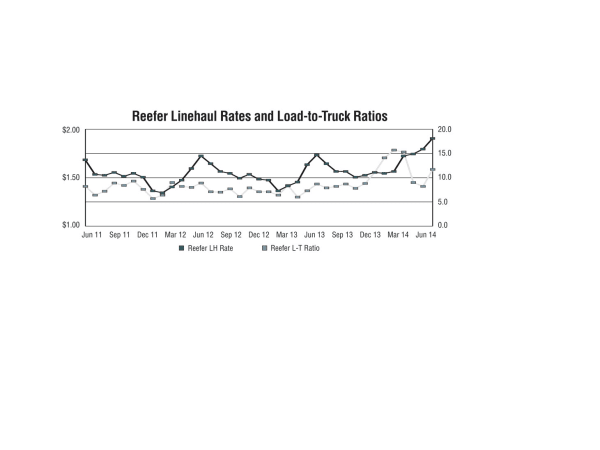
Refrigerated (“reefer”) freight has a strong seasonal element that drives rates up. The spike in load-to-truck ratios and rates in February and March 2014 was atypical, but the extreme weather caused a temporary capacity crisis. Capacity did not recover in time for Q2, and rates continued to climb. Source: DAT Solutions
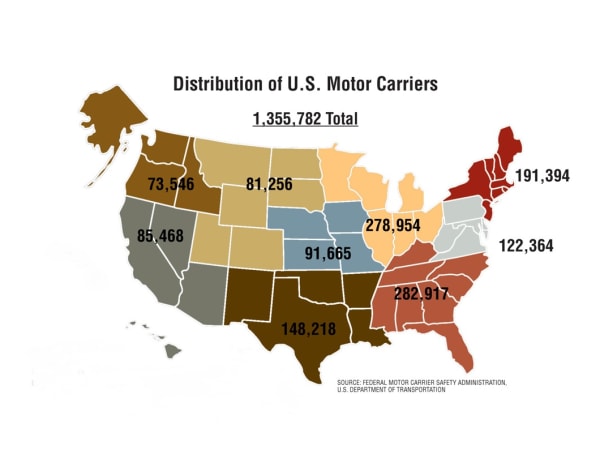
As of September 2013. Includes private, for-hire, and motor carriers who do not specify their segment of the industry or their fleet size. All other categories were excluded. Excludes carriers in Puerto Rico and the U.S. Virgin Islands.
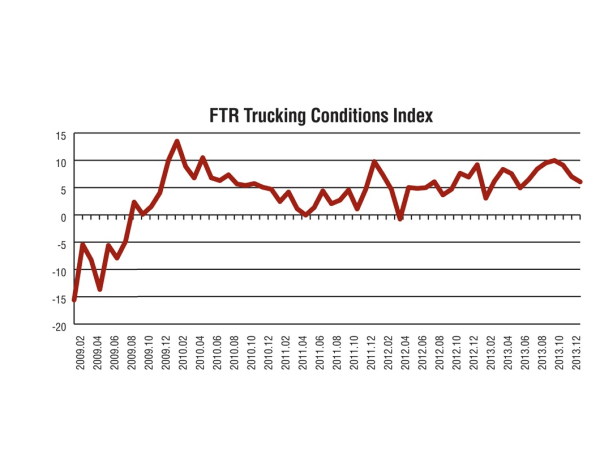
The TCI illustrates a change in market dynamics in that the market is more stable and positive versus the very large cyclical swings seen in prior decades. It is a compilation of factors affecting trucking companies. Readings above zero indicate a generally positive environment for truckers. Readings above 10 signal that volumes, prices, and margins are likely to be in a solidly favorable range. Source: FTR
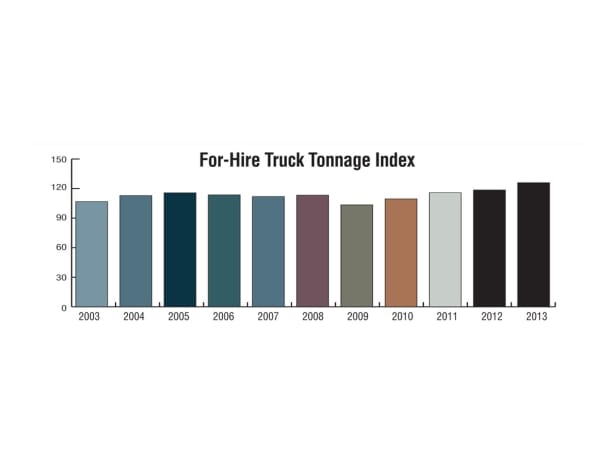
ATA’s For-Hire Truck Tonnage Index averaged 126.0 in 2013, up 6.3% from 2012 and the highest level in history. The previous highest annual average on record was 118.6 last year. In 2012, tonnage increased 2.3%, short of 2011’s 5.8% year-over-year increase. Source: Monthly Truck Tonnage Report, Economics & Statistics Group, American Trucking Associations
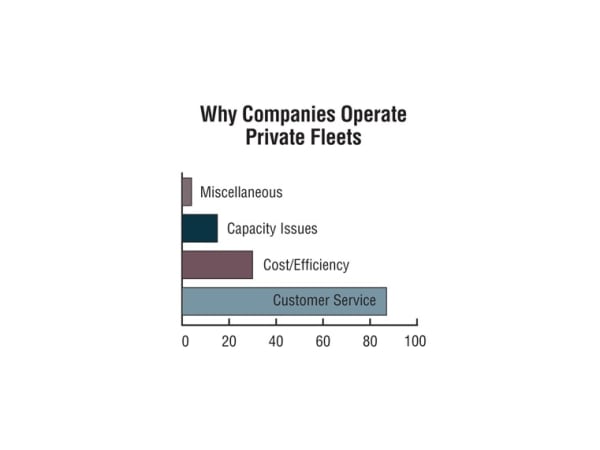
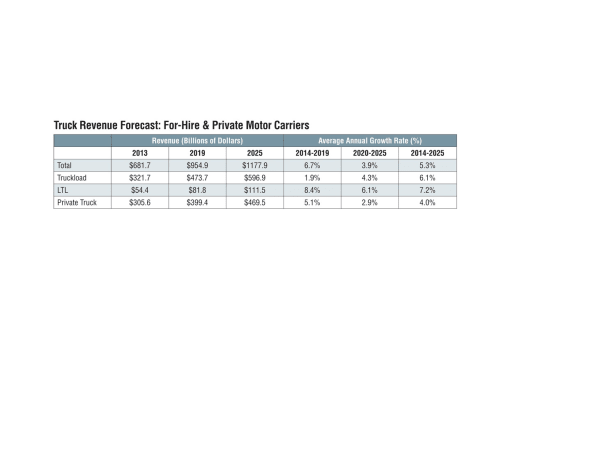
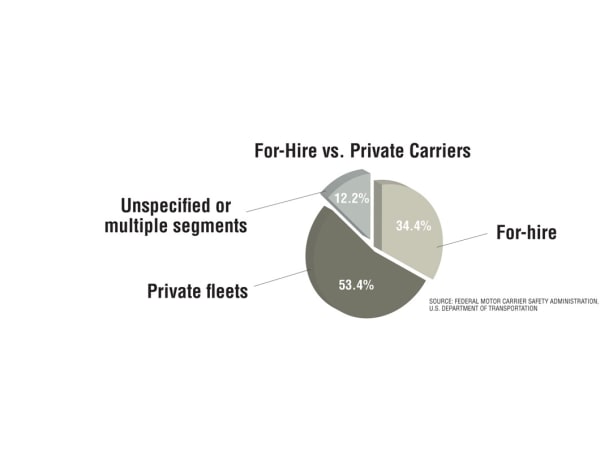
While providing exceptional customer service continues to be the dominant and overwhelming reason why companies operate a private truck fleet, increasingly, private fleets offers a cost advantage as compared to other transportation alternatives. Source: National Private Truck Council 2013 Benchmarking Survey
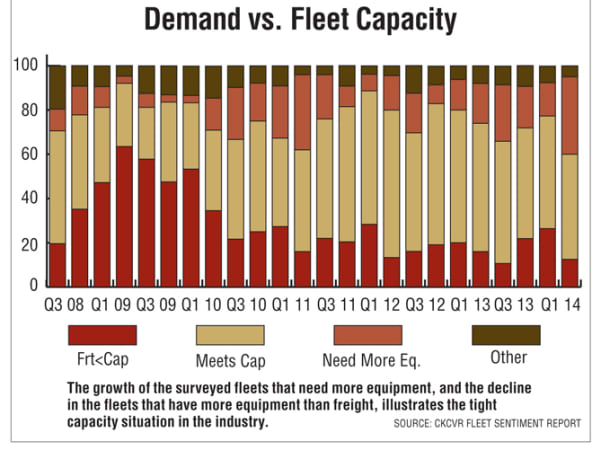
The growth of the surveyed fleets that need more equipment, and the decline in the fleets that have more equipment than freight, illustrates the tight capacity situation in the industry. Source: CKCVR Fleet Sentiment Report
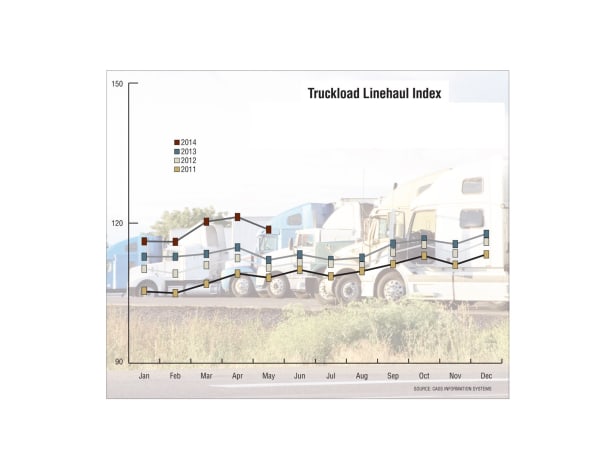
The Cass Truckload Linehaul Index is an accurate, timely indicator of market fluctuations in per-mile truckload pricing. The index isolates the linehaul component of full truckload costs from other components (e.g. fuel and accessorials), providing an accurate reflection of trends in baseline truckload prices. As of June 2014, truckload linehaul rates paid by North American shippers were 5.2% higher than in June of 2013. Source: Cass Information Systems
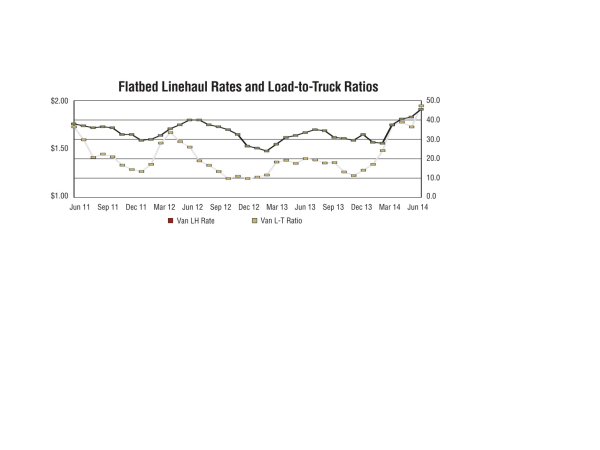
Flatbed demand, capacity and rates respond to trends in construction, drilling, automotive and other economic sectors that require heavy equipment and materials that can’t fit in a box van. Flatbed season typically begins in the spring. This year, demand has been climbing since January. Source: DAT Solutions