

2020 Fact Book: Sustainability [Photos]
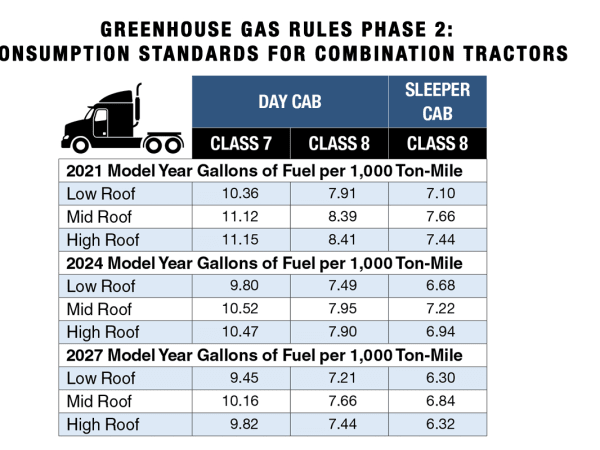
Phase 2 of the heavy-duty truck greenhouse gas emissions and fuel efficiency standards mandated by the Environmental Protection Agency and National Highway Traffice Safety Administration are projected to lower CO2 emissions by approximately 1.1 billion metric tons. Fuel consumption will decline as the new rules become tighter.
Source: EPA Office of Transportation and Air Quality
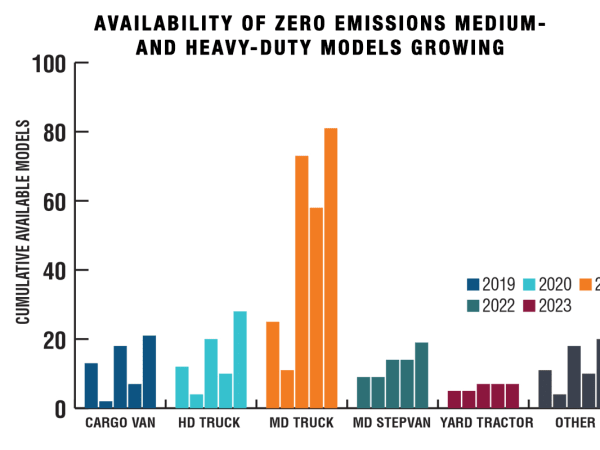
The number of models of zero-emission trucks, buses, and off-road equipment available globally is expected to double between the end of 2019 and 2023, according to an analysis by Calstart. Medium-duty trucks have the most models available between now and 2023, and this segment is showing the fastest growth, with 81 electric MD trucks by 2023, 67 of which will be available in the U.S. and Canada. While 20 electric heavy-duty trucks are projected to be available by 2023 as well, North America will only see 16 available at that time.
Source: Drive to Zero
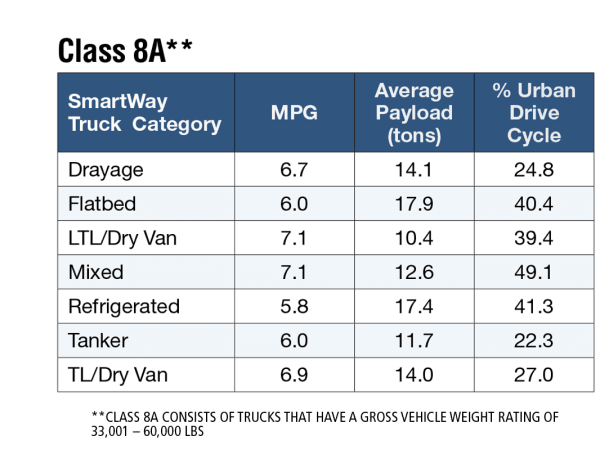
EPA SmartWay data from 2018 shows Class 7, 8A and 8B mileage-weighted miles per gallon data for each truck category for SmartWay program participants.
Source: EPA

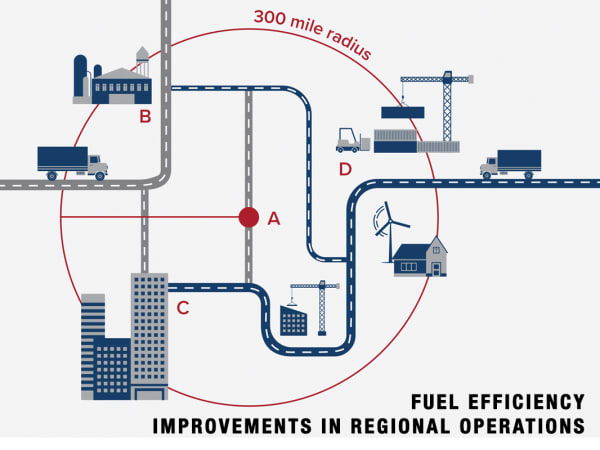
Based on its Run on Less Regional fuel-economy event, the North American Council on Freight Efficiency found that regional-haul fleets can improve their fuel efficiency by using data to optimize tractor operations for each route; understanding duty cycles to spec vehicles properly; and coach drivers in efficient driving techniques aimed at those duty cycles. And because of its return-to-base operation, regional haul is ideal for alternative-fuel vehicles, especially battery-electric trucks.
Source: NACFE
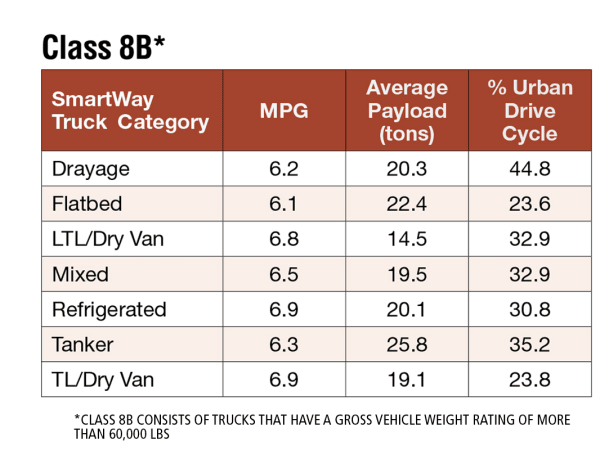
EPA SmartWay data from 2018 shows Class 7, 8A and 8B mileage-weighted miles per gallon data for each truck category for SmartWay program participants.
Source: EPA
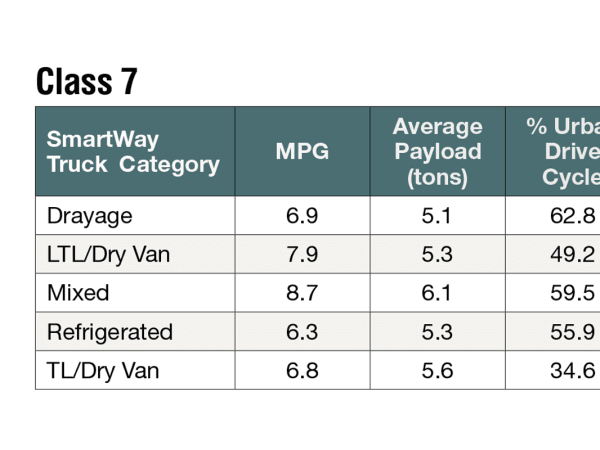
Not surprisingly, Class 7 trucks had the highest urban drive cycle percentages, since many more of these types of trucks are involved with last-mile deliveries, which consist of more stops along the route. Normally, the mpg would be much lower with this type of driving, but the greatly reduced payloads also reduced the fuel consumption.
Source: EPA
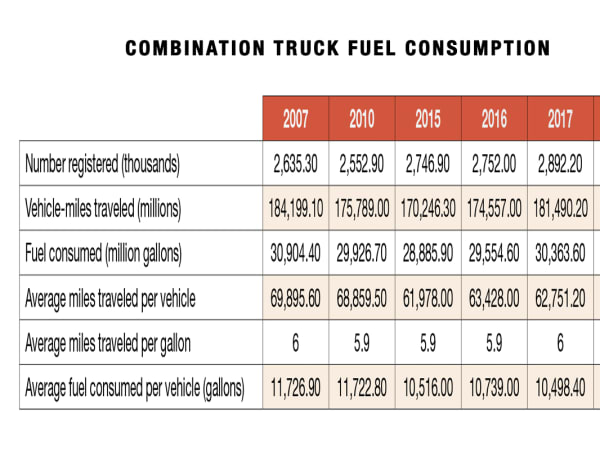
Miles per gallon for combination trucks (based on average miles traveled and fuel consumption) remained relatively stable between 2007 and 2018. However, fuel consumption decreased slightly, as the average miles traveled per vehicle declined by 9.3%.
Source: U.S. Department of Transportation, Federal Highway Administration, Highway Statistics (Washington, DC: annual issues), table VM-1, as of March 2020.
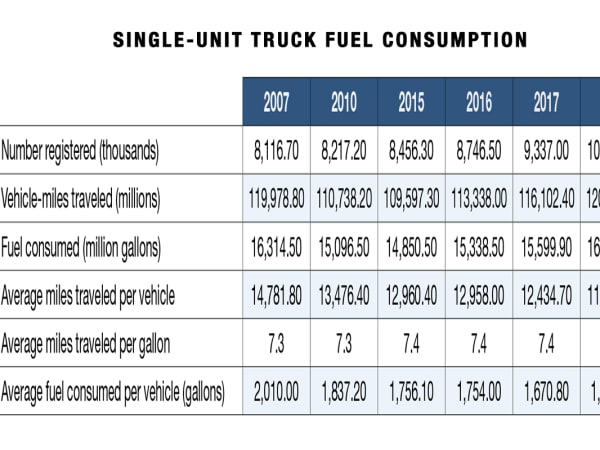
Miles per gallon of single-unit trucks (based on total travel and fuel consumption) increased by 2.7% from 7.3 mpg to 7.5 mpg from 2007 to 2018. Total fuel consumption declined slightly as single-unit trucks traveled 20.9% fewer miles per vehicle.
Source: U.S. Department of Transportation, Federal Highway Administration, Highway Statistics (Washington, DC: annual issues), table VM-1, as of March 2020.