

2020 Fact Book: Industry [Photos]
HDT’s sixth annual Fact Book is a fascinating overview of our industry by the numbers. The following graphs, charts, tables, and infographics are designed to not only give you a snapshot of the industry at this point in time, but also to serve as a reference guide you can keep handy throughout the year.

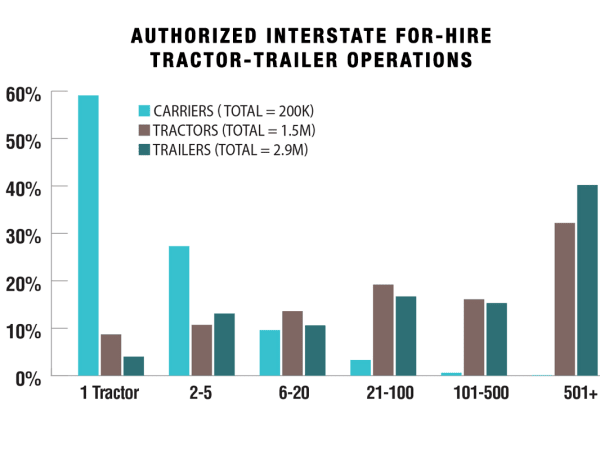
Motor carriers with just one tractor represent 59.1% of all U.S. carriers but only 8.1% of the tractors and only 4% of the trailers operated by authorized U.S. for-hire tractor-trailer operations. On the other end of the spectrum, carriers with more than 500 tractors make up just 0.1% of all carriers but operate 32.2% of the tractors and 40.2% of the trailers.
Source: FMCSA MCMIS database,May 2020; FTR Analysis
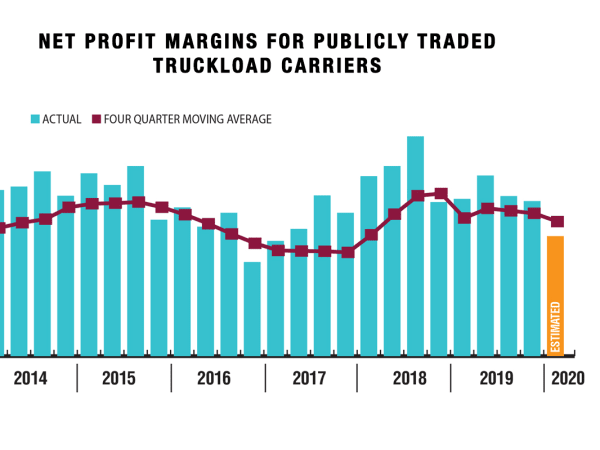
In Q1 2020, public for-hire TL carrier profitability, at 3.8%, was down compared to Q1 2019, the lowest margin since Q3 2017 — just ahead of the ELD mandate and business tax cuts that simultaneously boosted freight and constrained capacity, ultimately ushering in the period of highest profitability on record. Much like the spot rate market, profit margins reflect the supply-demand balance between freight demand and the supply of capacity. Carrier profits are key determinant of new Class 8 tractor and trailer demand.
Source: ACT Research
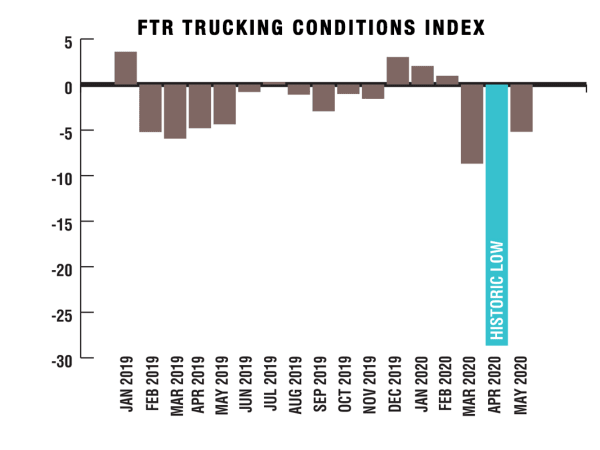
The TCI was significantly negative through the first half of 2019 for the first time since 2015, but conditions had largely stabilized before the COVID-19 pandemic resulted in the worst-ever reading in April 2020. The Trucking Conditions Index tracks the changes representing five major conditions: freight volumes, freight rates, fleet capacity, fuel price, and financing.
Source: FTR
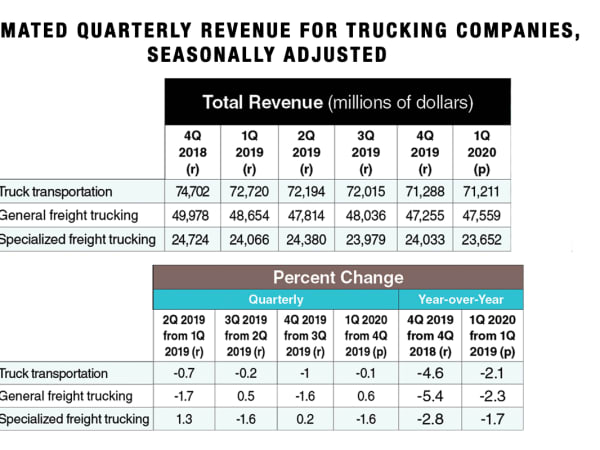
Estimated revenue for the first quarter of 2020 is down slightly from a year earlier, but the rest of the year will surely see a greater impact from the COVID-19 outbreak.
Note: (r) equals real revenue; (p) is preliminary.
Source: U.S. Census Bureau
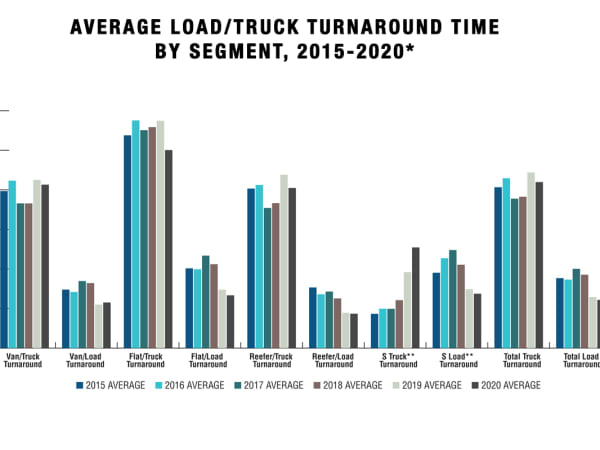
Truck turnaround time measures the time it takes to find a load after unloading at the previous customer. The shorter the time, the better it is for the market and for productivity. The numbers for 2020, averaged from the first seven months, show a somewhat better than average year. In fact, 2020 has been a volatile year, with short turnaround times early, long turnaround time at the peak of the COVID-19 shutdown, and now short turnaround times again. Since truck tonnage has come back relatively strongly, turnaround times are expected to remain quite low for the rest of 2020.
*2020 average includes times through the first week of July.
**S Truck Turnaround refers to trailer loads that are not defined as reefer, flat or van.
Source: Truckstop.com
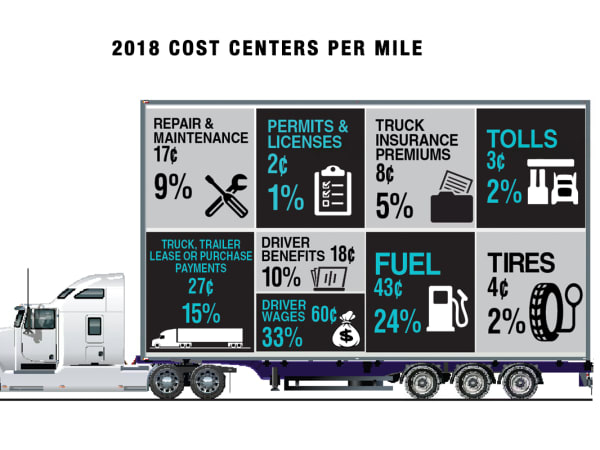
While most cost center percentages stayed relatively close to the previous year, according to the American Transportation Research Institute, the average marginal costs per mile increased from $1.69 to $1.82 in 2018, the most recent numbers available.
Note: Numbers do not add up to 100% due to rounding
Source: American transportation Research Institute