

2019 Fact Book: Trucking Industry Stats
HDT’s fifth annual Fact Book is a fascinating overview of our industry by the numbers. The following graphs, charts, tables, and infographics are designed to not only give you a snapshot of the industry at this point in time, but also to serve as a reference guide you can keep handy throughout the year.

The following graphs, charts, tables, and infographics are designed to not only give you a snapshot of the industry at this point in time, but also to serve as a reference guide you can keep handy throughout the year.
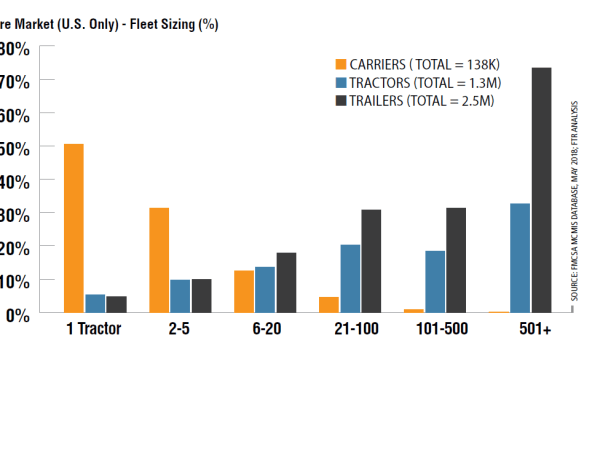
U.S. authorized for-hire tractor-trailer operations with just 1 tractor represent 59.1% of all U.S. carriers but only 8.1% of the tractors and only 4% of the trailers operated by authorized for-hire tractor-trailer operations. On the other end of the spectrum, carriers with more than 500 tractors make up just 0.1% of all carriers but operate 32.2% of the tractors and 40.2% of the trailers.
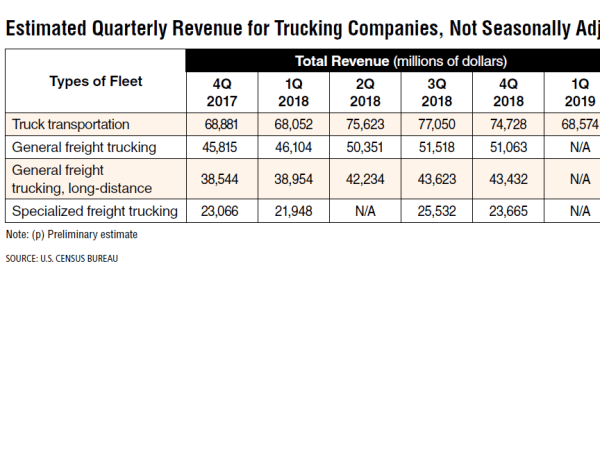
Estimated revenue for the first quarter of 2019 is up only slightly from a year earlier.
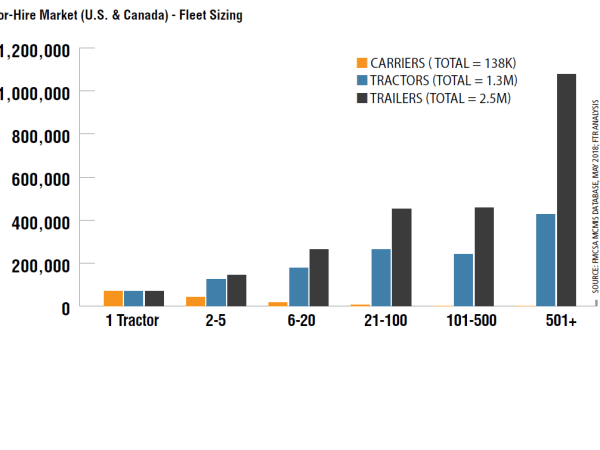
Combining U.S. and Canadian tractor-trailer operations that hold FMCSA authority, the picture is essentially the same, with 1-tractor operations making up 58.5% of carriers but only 7.9% of tractors and 4% of trailers. Carriers with more than 500 tractors represent 0.1% of carriers but 30.7% of tractors and 37.5% of trailers.
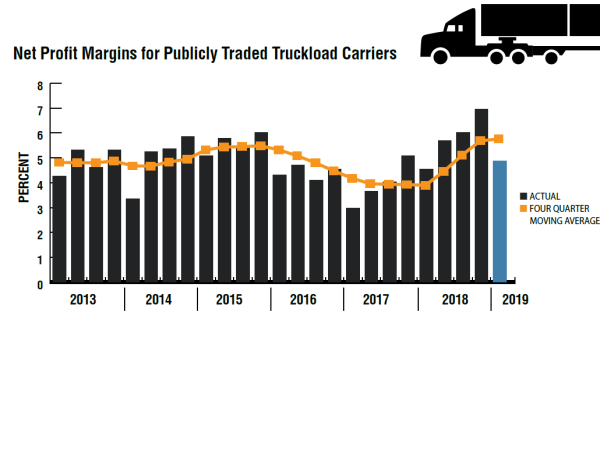
Trucking company profitability tends to lag the freight cycle: In 2018, contracts got signed when demand was hot, and those rates have helped to support profitability even with spot freight rates deep under water. In Q4, the core carrier tracked by ACT posted all-time record margins at 7.0%, up 270 basis points (2.7%) year over year. While Q1 is always a letdown from Q4, it still ranked as the fifth best all-time profitability quarter at 4.9%, but up just 30 basis points (0.3%) above increasingly tough year-ago comparisons. With spot rates pulling contract rates lower, expect profitability to deteriorate into the end of 2019 and into early 2020 as the supply-demand imbalance favors shippers.
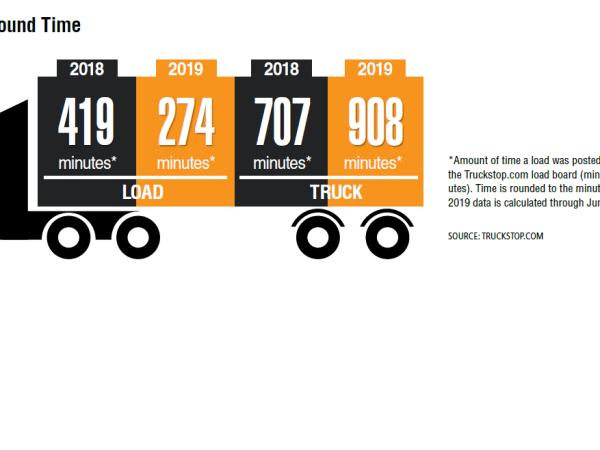
A longer turnaround time indicates that it is taking longer for any particular load to be accepted for cartage. 2019 has seen a drop of almost 35% in terms of load turnaround time.
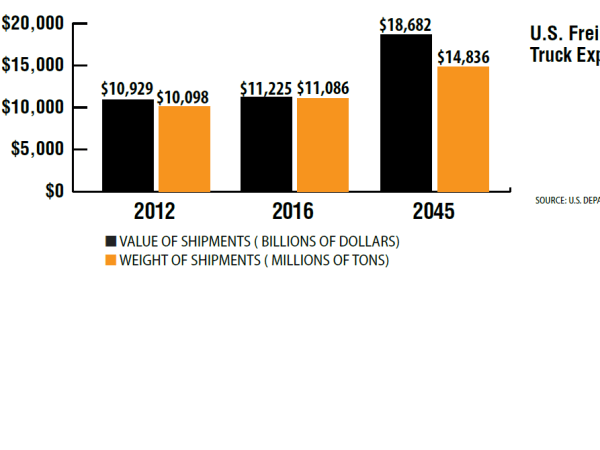
DOT currently projects the weight of goods moved by truck to rise by close to 34% by 2045, compared to 2016. The value of goods moved by truck is expected to increase by approximately 66% from 2016.
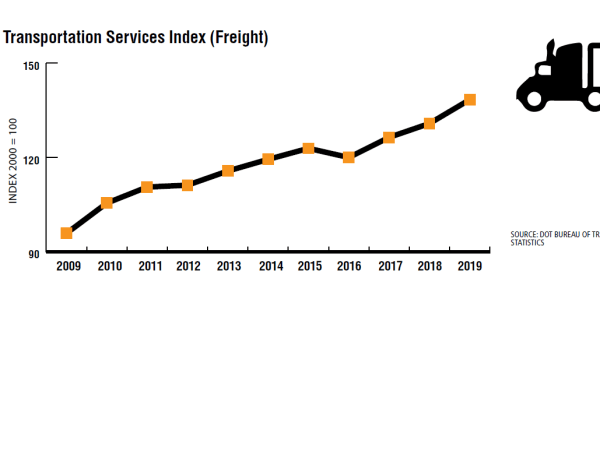
The Freight Transportation Services Index (TSI), based on the amount of freight carried by the for-hire transportation industry, hit an all-time high of 138.7 in November 2018.
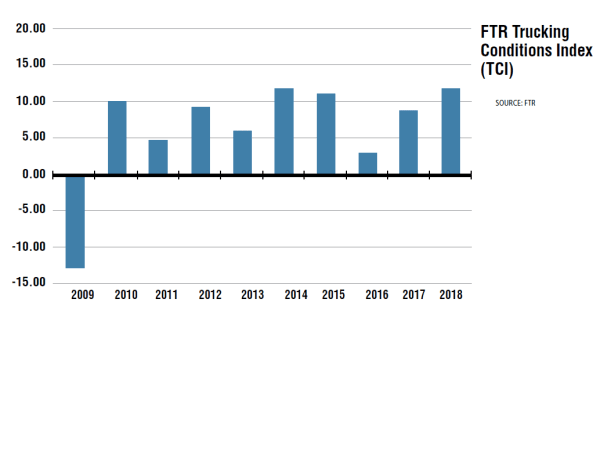
The Trucking Conditions index tracks changes in the U.S. truck market related to freight volumes, freight rates, fleet capacity, fuel prices, and financing and combines the metrics into a single score. The TCI shows that conditions were extraordinarily strong until Q4, although December 2018 was a strong outlier in a generally stabilizing market.
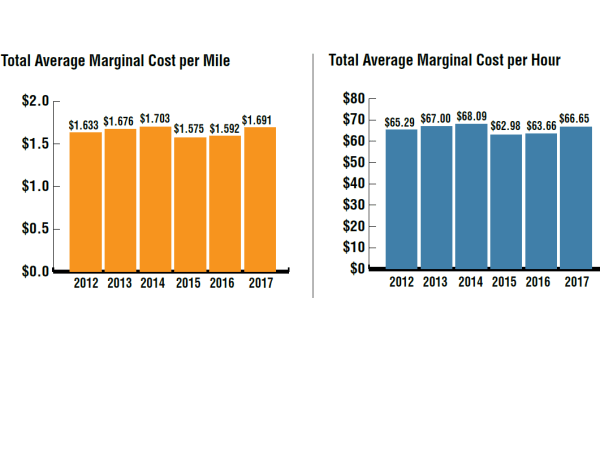
The 2018 update to ATRI’s Analysis of the Operational Costs of Trucking shows that the average marginal cost per mile for fleets rose 6% in 2017 to $1.69, thanks largely to increased fuel and driver costs. Over the nine years of ATRI research, costs have only topped that mark in 2011 and 2015, at around $1.70.
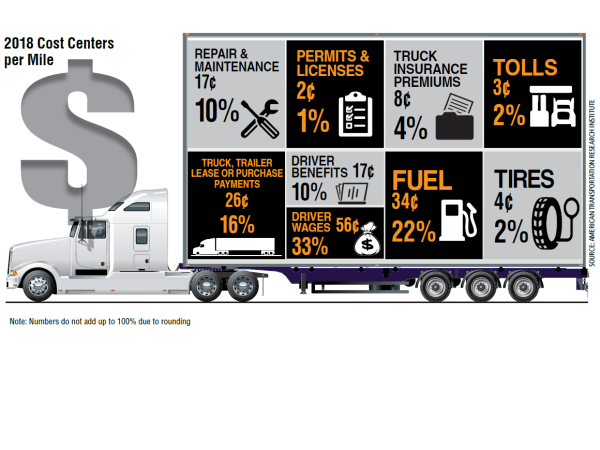
Compared to 2017 cost per mile, truck, trailer lease or purchase payments; repair and maintenance; fuel; tires; permits and licenses; and insurance premiums all practically remained flat, while driver benefits increased by 1¢, driver wages by 4¢, and tolls by 1¢.