

2019 Fact Book: Logistics
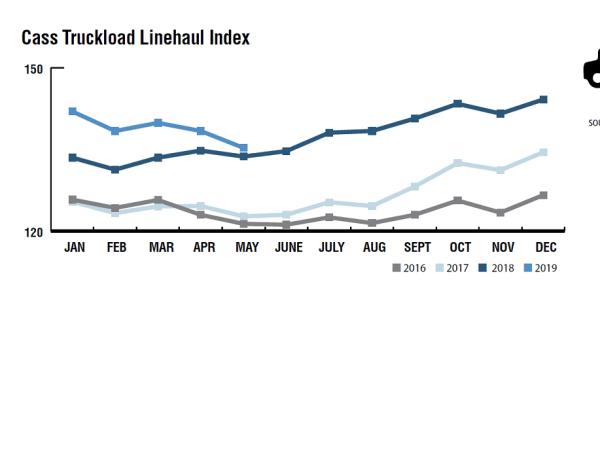
The Cass Truckload Linehaul Index is a measure of market fluctuations in per-mile truckload linehaul rates, independent of additional cost components such as fuel and accessorials. Since January, there has been a steady decline through May 2019.
After seeing a weak market during 2015 and 2016 demand for trucking services was on the upswing in 2017. By the end of the year trucking was running quite hot, which continued into 2018.
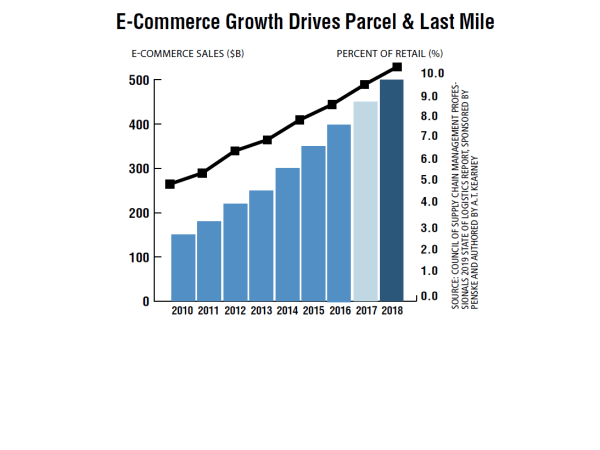
As e-commerce sales hit $513 billion, nearly 10% of total retail, in 2018, parcel expenditures rose 8.7% to $105 billion. Amazon is training customers to expect ever-faster deliveries, forcing competitors to chase those expectations, while at the same time growing its own transportation network and entering the third-party logistics business. This is sparking a furious pace of last-mile innovation, partnerships, and new technology.
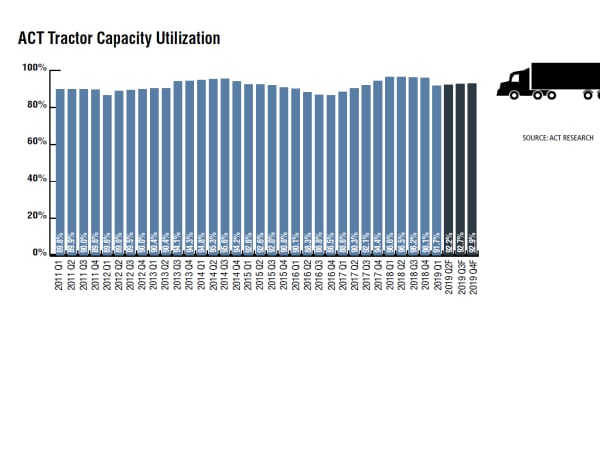
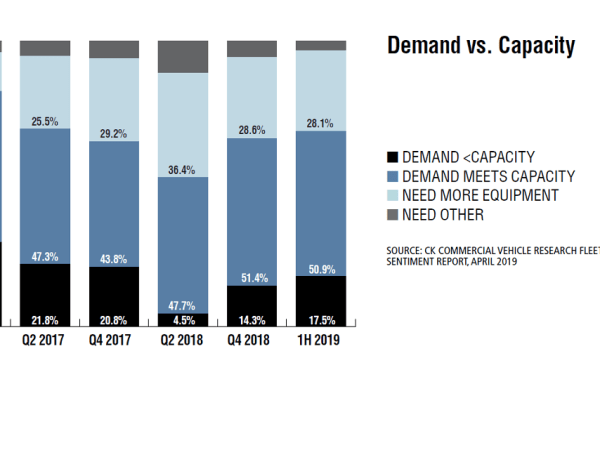
The combination of strong fleet growth, weak freight growth, and an easing of driver supply constraints took what was an historically tight capacity market in Q2’18 (96.5%), and turned it into a loose capacity market by Q2’19 (92.2%). As ACT measures capacity, 91% is considered neutral.
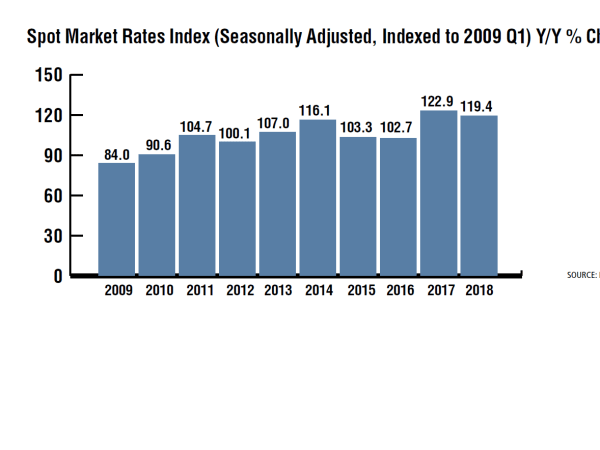
After extraordinary growth in the first half of 2018, spot rates finally began to stabilize in Q4 in comparison to the beginning of the rate surge in late 2017.
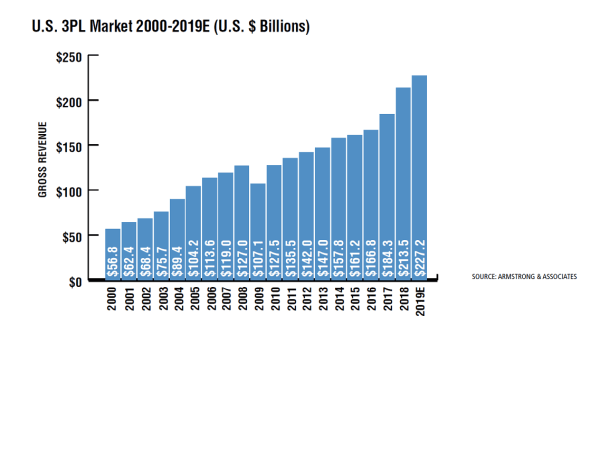
The U.S. 3PL market gross revenues increased 15.8%, bringing the total U.S. 3PL market to $213.5 billion in 2018. The last time the U.S. saw this level of 3PL gross revenue growth was in 2010 when the 3PL market bounced back 19% from its 16% decline in 2009 during the Great Recession.
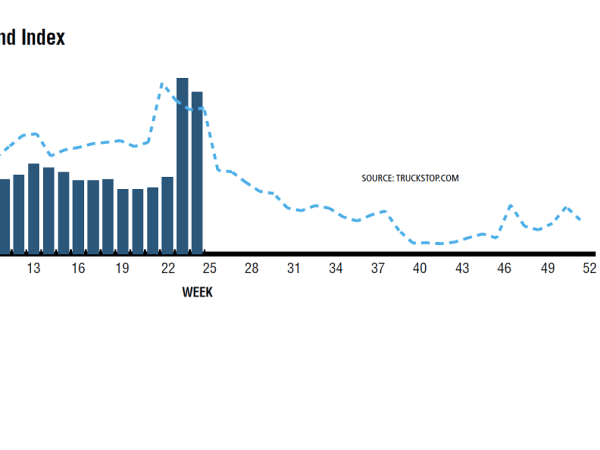
The MDI (Market Demand Index) is a simple division problem: Load count divided by truck count, i.e. the ratio of loads to trucks. There is X number of loads for every given truck.
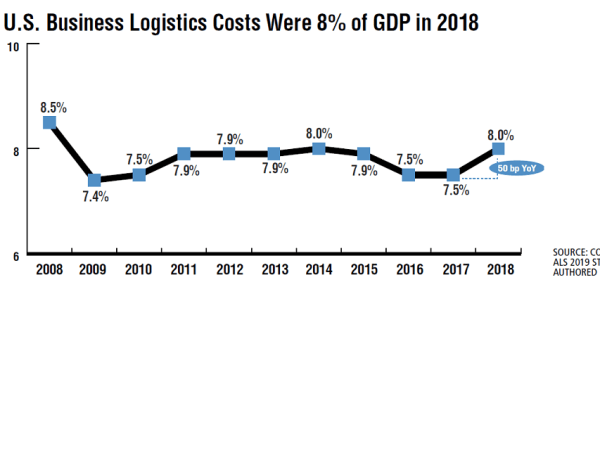
U.S. business logistics costs, as calculated in CSCMP’s 2019 State of Logistics Report, sponsored by Penske and authored by A.T. Kearney, rose 11.4% in 2018 to reach $1.64 trillion, or 8% of the $20.5 trillion GDP. All sub segments rose to their highest level since 2014, with private and dedicated fleets leading the way, up by 13%. Truckload was up 8.3%, LTL up 7.6%. Parcel was up over 7%, reflecting strong e-commerce growth and pricing power from providers. In addition, a buildup in inventory in the second half of the year drove inventory costs up 14.8%.
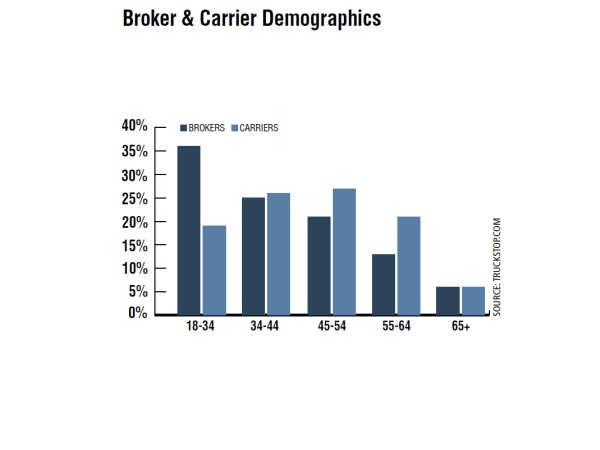
Brokers and carriers have similar age demographics in the 35-44 age bracket, but carriers have an older workforce from ages 45 to 64. Both brokers and carriers report that 12% are veterans. Of those, 13% are independent owner-operators with their own authority, and 23% own their truck and lease to a carrier.