

2019 Fact Book: Equipment [Photos]
After fleets bought new trucks and trailers at records rates in 2018, this year has seen a major slowdown and the 2019 HDT Fact Book tells the story of this downward trucking trend.
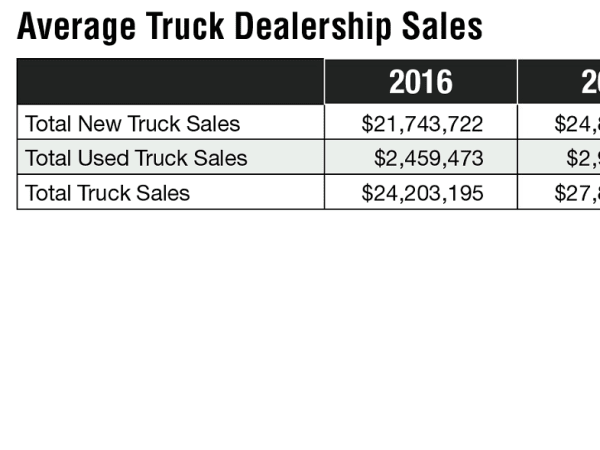
Dealers have increased both new and used truck sales by 27% and 36% between 2016 and 2018, respectively.
Source: ATD
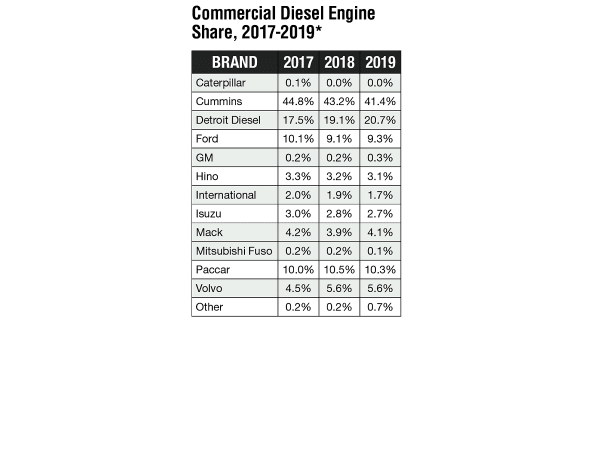
While Cummins has lost approximately 2.5% of its market share since 2017, it still retains close to 50% of the overall diesel engine market. Aside from Detroit Diesel, which saw a 3.2% growth in terms of market share, the remaining manufacturers have only lost or gained a portion of a percentage point over the last two years. Note: Diesel engine shares are calculated for Class 4-8
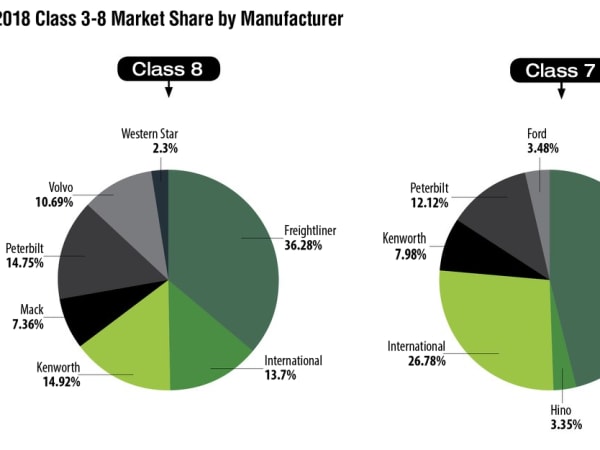
Source: IHS Markit
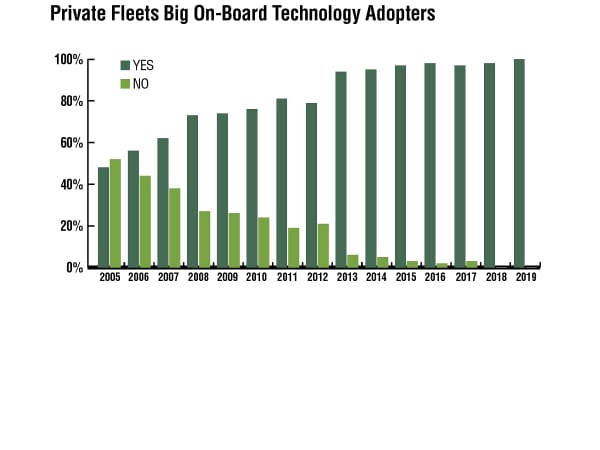
One effective strategy private fleets continue to employ to help improve their productivity is the deployment of on-board technology — combined with better data aggregation and analysis — to track and improve various elements of their performance. Fleets have been steadily adopting such technology and this year, every fleet that answered the question in NPTC's annual member survey reported adopting the technology. This is in line with the near universal penetration of on-board technology achieved in each of the last seven years. To put that number in perspective, in 2005, the penetration of on-board technology was reported at less than 50%. On-board technology provides data that can lead to more effective methods to understand, communicate, and improve value, performance and safety. The challenge and frustration expressed on the part of the fleets is to detangle the massive amounts of data and convert it into actionable intelligence. In fact, 29% of the respondents reported employing data analysts or information technology experts.
Source: National Private Truck Council
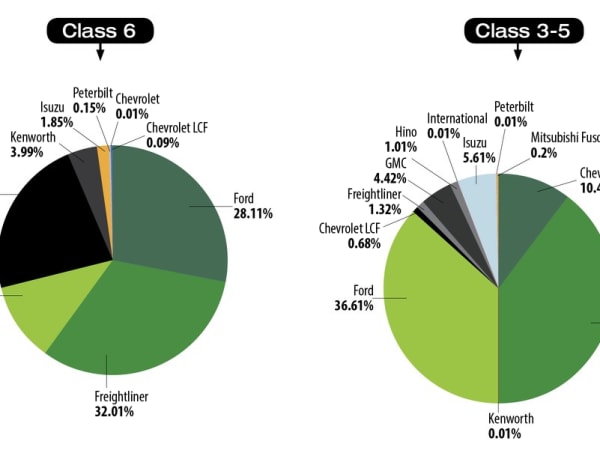
Source: Ward’s Communications
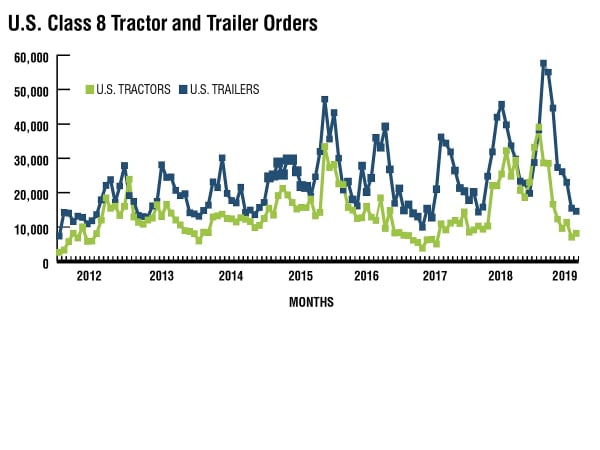
For U.S. Class 8, orders averaged 40,800 units per month in 2018, but for the first half of 2019, just 14,600 per month. Similarly, U.S. trailer orders averaged 35,100 units/mo. in 2018, and have managed just 13,500 units per month in the three months ending May. Much of the weakness in orders in the first half of 2019 is a reflection of the strength in orders in 2018 and the large, filled backlogs at the start of the year. We are just at the point where the order focus will shift to 2020, so weakness from here on out will be more indicative of future activity than the order weakness experienced year to date.
Source: ACT Research
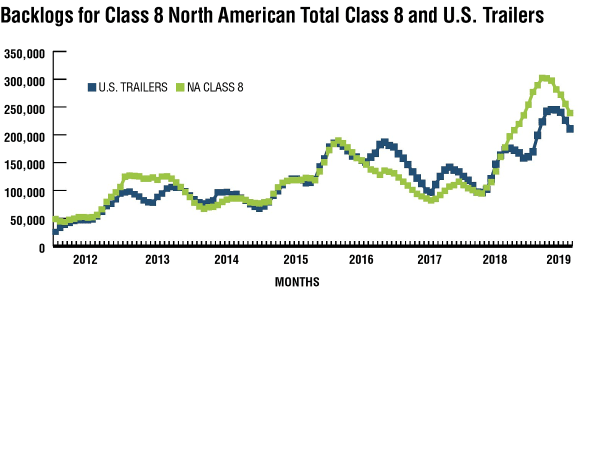
For U.S. trailers, backlogs at the end of May were 191,000 units. At around 24,000 units of build per month, the trailer industry was sporting a 6.6-month backlog/build ratio. For Class 8, backlogs at the end of May were 214,800 units, with the backlog/build ratio sitting at 7.1 months. A far cry from the 10-plus-month ratios witnessed in Q4’18, but compared to just about any other time in history, still very large. Worth noting: For both markets, backlog burn rates are around 15,000 units per month. Hence, without stronger orders, backlogs will continue to dwindle, especially through the historically weak summer order period.
Source: ACT Research
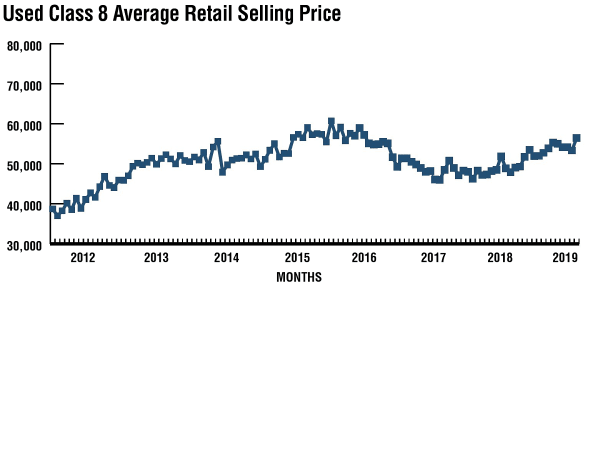
Despite the slowdown in orders and falling backlogs, demand for used equipment persists at high levels. In April 2019, average used prices were up nearly 15% from a year earlier. Strength in used equipment, like new equipment, is attributed both to strong carrier profitability tailwinds into 2019 and the rapid improvements in technology and fuel economy that have come into the fleet in the current decade. Replacing an older truck with a fuel-efficient late model truck will help to offset falling freight rates.
Source: ACT Research
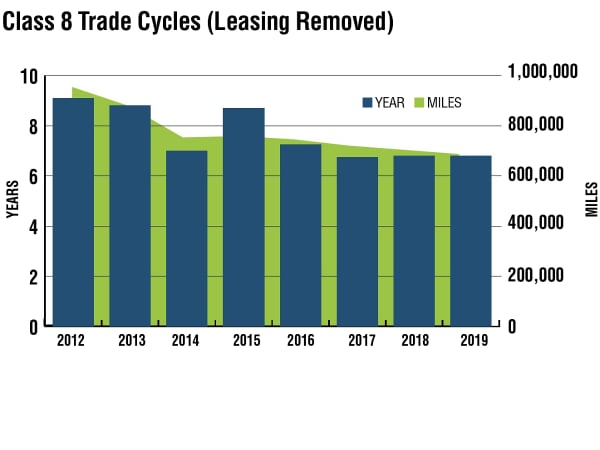
To get a more complete picture of the trade cycle strategies, when those fleets that lease the majority of their equipment were removed, the trade cycles lengthened slightly to 6.8 years (exactly the same as last year’s reported average and up from the previous year’s 6.75 years. Equipment turns averaged 649,000, down from the 665,000 miles reported last year and down from 681,200 miles for this same class of vehicle reported two years ago. For comparison purposes, in 2015, trade cycles for this same class averaged 8.74 years and 717,000 miles reported last year. Even those fleets that lease the majority of their equipment report extending the trade cycle out to 5.5 years and 580,000 miles.
Source: National Private Truck Council
Source: Ward’s Communications