

2018 Fact Book: Trucking Industry Stats
Heavy Duty Trucking Magazine's annual Fact Book is a statistical overview of the trucking industry presented in graphical format to give readers a snapshot of the trucking industry as it is today.

Heavy Duty Trucking Magazine's annual Fact Book is a statistical overview of the trucking industry presented in graphical format to give readers a snapshot of the trucking industry as it is today.
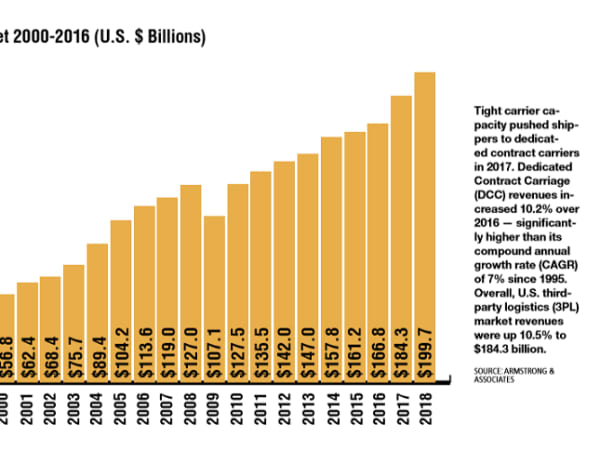
Tight carrier capacity pushed shippers to dedicated contract carriers in 2017. Dedicated Contract Carriage (DCC) revenues increased 10.2% over 2016 — significantly higher than its compound annual growth rate (CAGR) of 7% since 1995. Overall, U.S. third-party logistics (3PL) market revenues were up 10.5% to $184.3 billion.
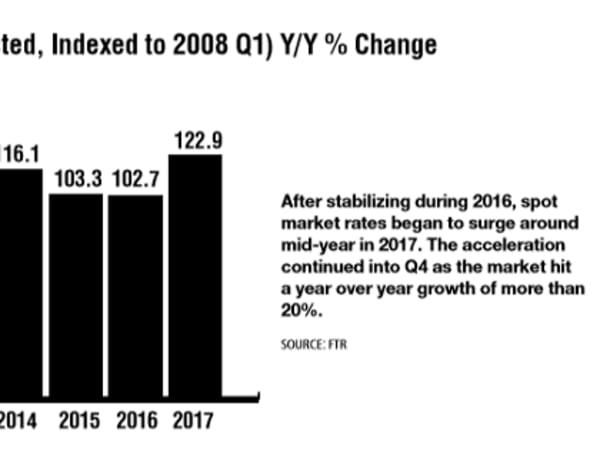
After stabilizing during 2016, spot market rates began to surge around mid-year in 2017. The acceleration continued into Q4 as the market hit a year over year growth of more than 20%.
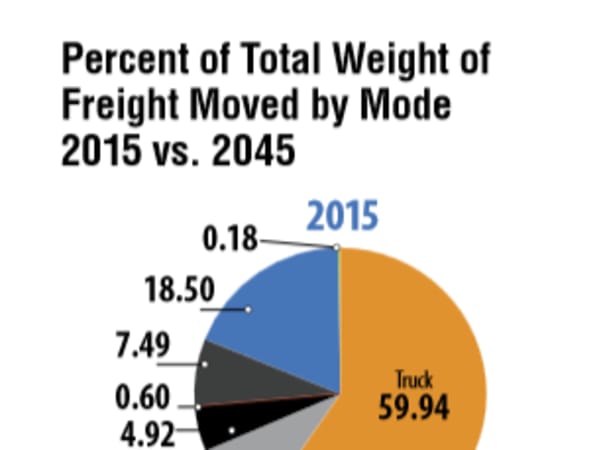
DOT currently projects the weight of goods moved by truck to rise by close to 33% by 2045, compared to last year’s projection of 44%. The value of goods moved by truck is expected to increase by approximately 61%, a drop from last year’s 84%.
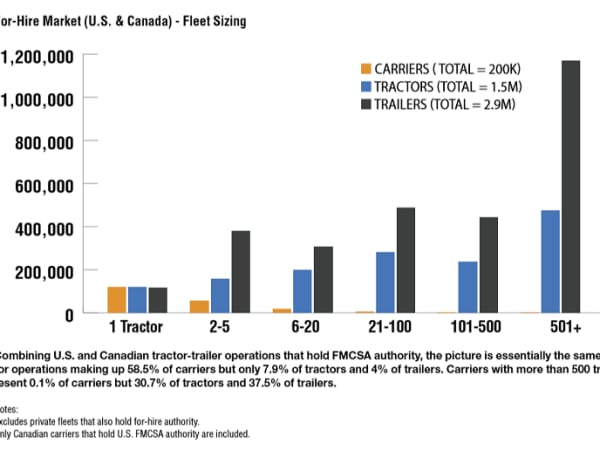
Combining U.S. and Canadian tractor-trailer operations that hold FMCSA authority, the picture is essentially the same with 1-tractor operations making up 58.5% of carriers but only 7.9% of tractors and 4% of trailers. Carriers with more than 500 tractors represent 0.1% of carriers but 30.7% of tractors and 37.5% of trailers.
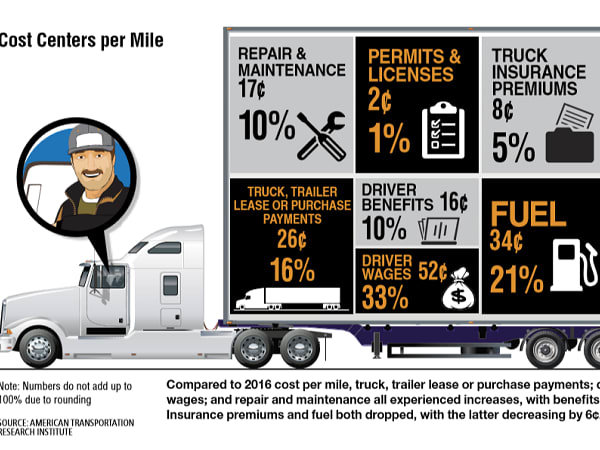
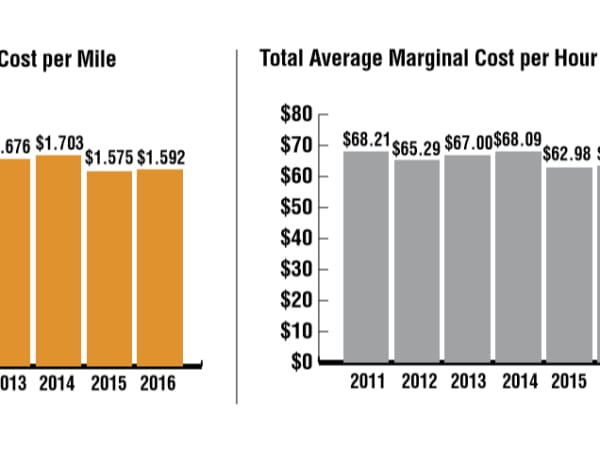
Compared to 2016 cost per mile, truck, trailer lease or purchase payments; driver benefits; driver wages; and repair and maintenance all experienced increases, with benefits topping the list at 3¢. Insurance premiums and fuel both dropped, with the latter decreasing by 6 cents.
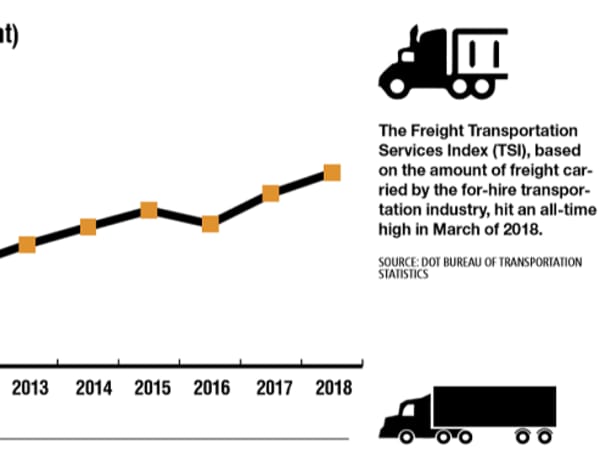
The Freight Transportation Services Index (TSI), based on the amount of freight carried by the for-hire transportation industry, hit an all-time high in March of 2018.
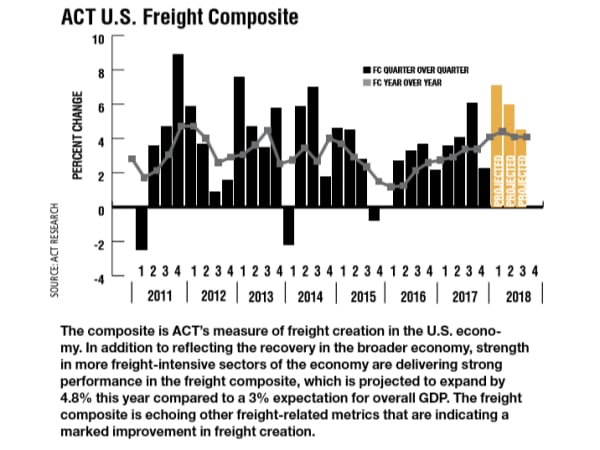
The composite is ACT’s measure of freight creation in the U.S. economy. In addition to reflecting the recovery in the broader economy, strength in more freight-intensive sectors of the economy are delivering strong performance in the freight composite, which is projected to expand by 4.8% this year compared to a 3% expectation for overall GDP. The freight composite is echoing other freight-related metrics that are indicating a marked improvement in freight creation.
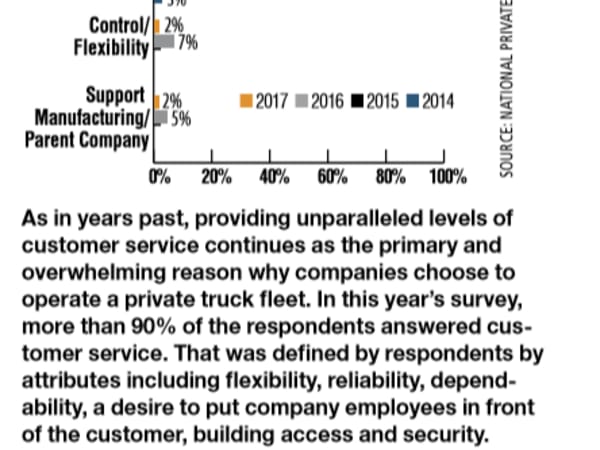
As in years past, providing unparalleled levels of customer service continues as the primary and overwhelming reason why companies choose to operate a private truck fleet. In this year’s survey, more than 90% of the respondents answered customer service. That was defined by respondents by attributes including flexibility, reliability, dependability, a desire to put company employees in front of the customer, building access and security.
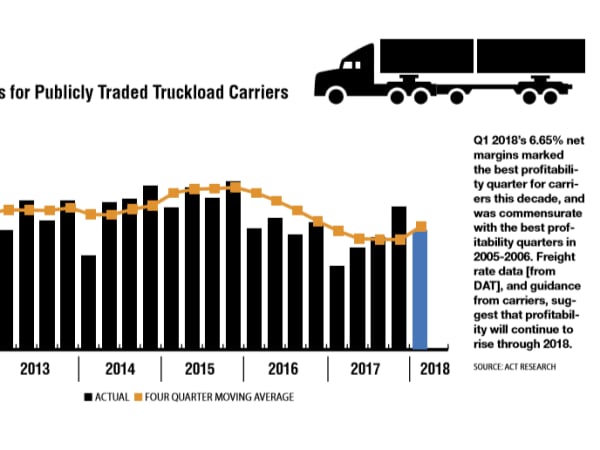
Q1 2018’s 6.65% net margins marked the best profitability quarter for carriers this decade, and was commensurate with the best profitability quarters in 2005-2006. Freight rate data [from DAT], and guidance from carriers, suggest that profitability will continue to rise through 2018.
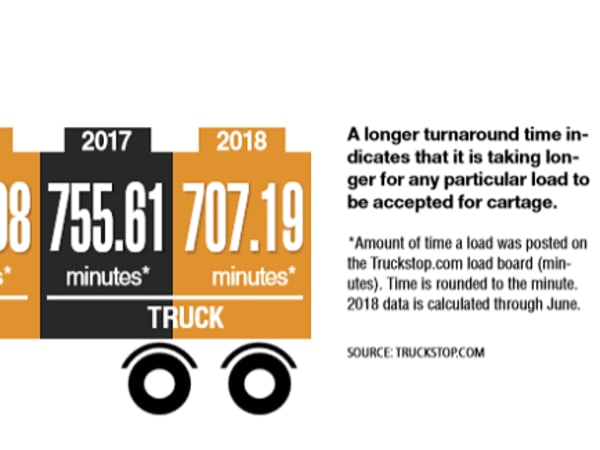
A longer turnaround time indicates that it is taking longer for any particular load to be accepted for cartage. Amount of time a load was posted on the Truckstop.com load board (minutes). Time is rounded to the minute. 2018 data is calculated through June.
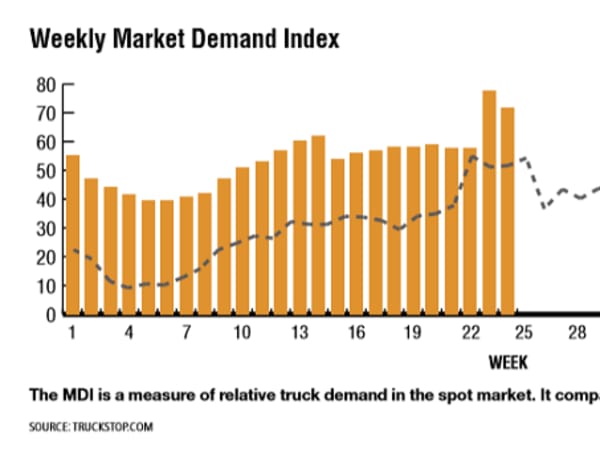
The MDI is a measure of relative truck demand in the spot market. It compares load availability to truck availability.
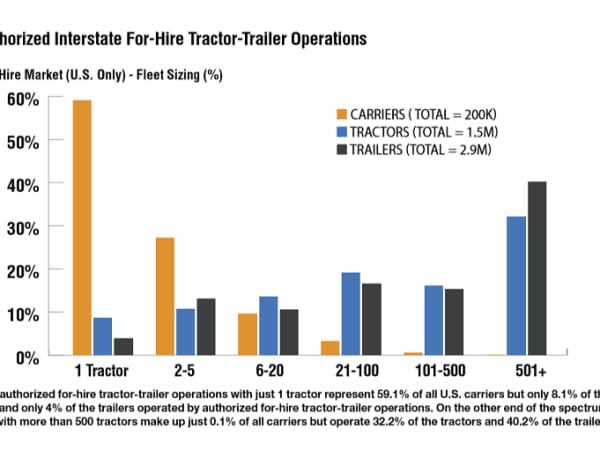
U.S. authorized for-hire tractor-trailer operations with just 1 tractor represent 59.1% of all U.S. carriers but only 8.1% of the tractors and only 4% of the trailers operated by authorized for-hire tractor-trailer operations. On the other end of the spectrum, carriers with more than 500 tractors make up just 0.1% of all carriers but operate 32.2% of the tractors and 40.2% of the trailers.
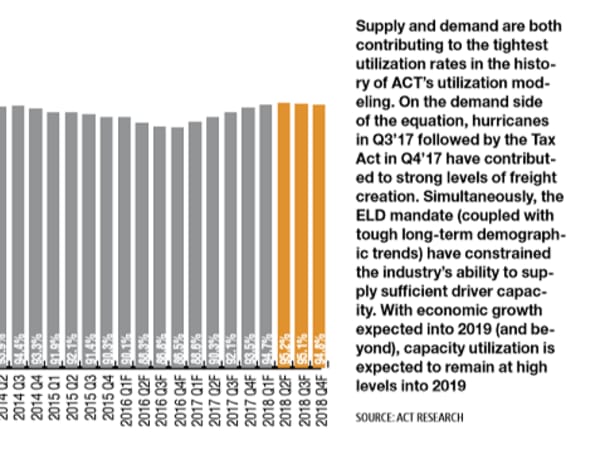
Supply and demand are both contributing to the tightest utilization rates in the history of ACT’s utilization modeling. On the demand side of the equation, hurricanes in Q3’17 followed by the Tax Act in Q4’17 have contributed to strong levels of freight creation. Simultaneously, the ELD mandate (coupled with tough long-term demographic trends) have constrained the industry’s ability to supply sufficient driver capacity. With economic growth expected into 2019 (and beyond), capacity utilization is expected to remain at high levels into 2019
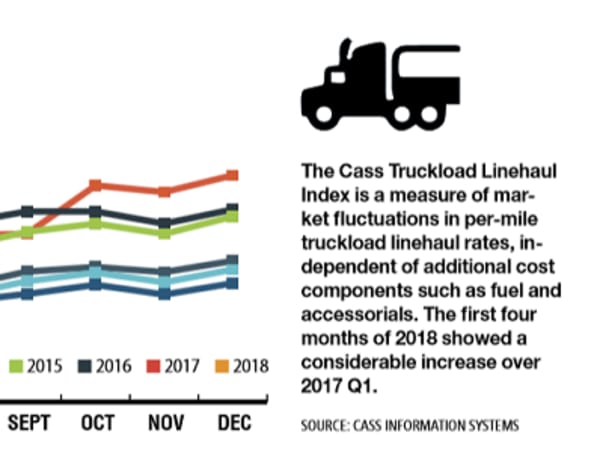
The Cass Truckload Linehaul Index is a measure of market fluctuations in per-mile truckload linehaul rates, independent of additional cost components such as fuel and accessorials. The first four months of 2018 showed a considerable increase over 2017 Q1.
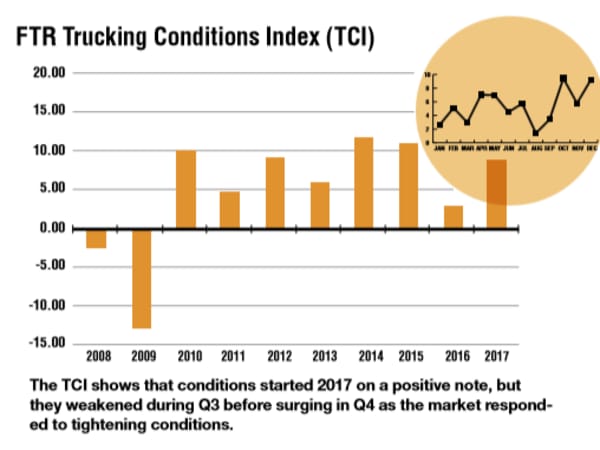
The TCI shows that conditions started 2017 on a positive note, but they weakened during Q3 before surging in Q4 as the market responded to tightening conditions.
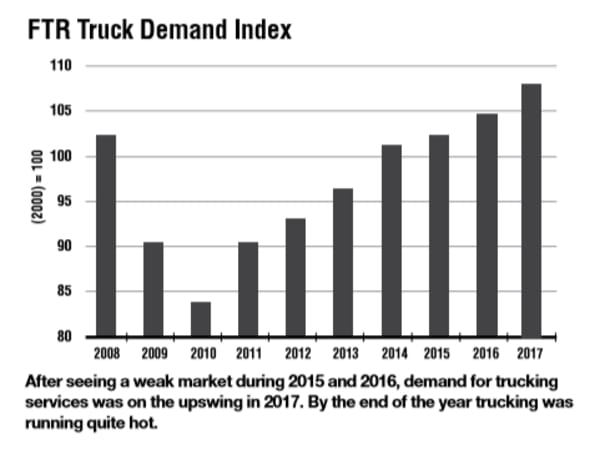
Services was on the upswing in 2017. By the end of the year trucking was running quite hot.
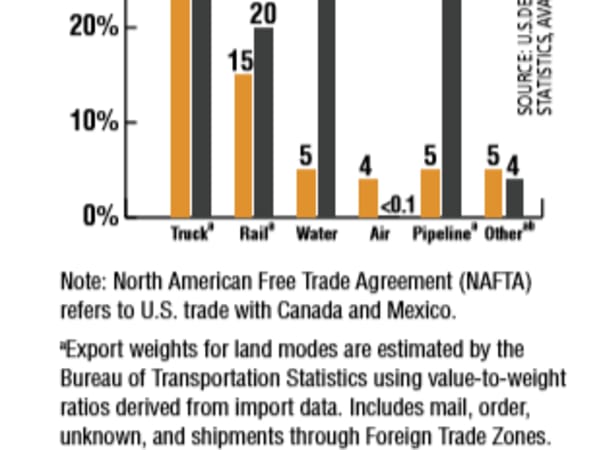
Export weights for land modes are estimated by the Bureau of Transportation Statistics using value-to-weight ratios derived from import data. Includes mail, order, unknown, and shipments through Foreign Trade Zones.
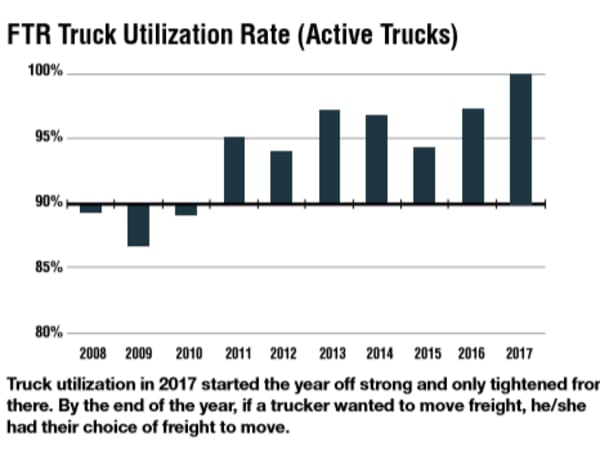
Truck utilization in 2017 started the year off strong and only tightened from there. By the end of the year, if a trucker wanted to move freight, he/she had their choice of freight to move.