

2018 Fact Book: Highways
The decline of our nation's highways is evident in our 2018 Fact Book, with statistics indicating increasing congestion in our busiest regions and an increasing need for repair.
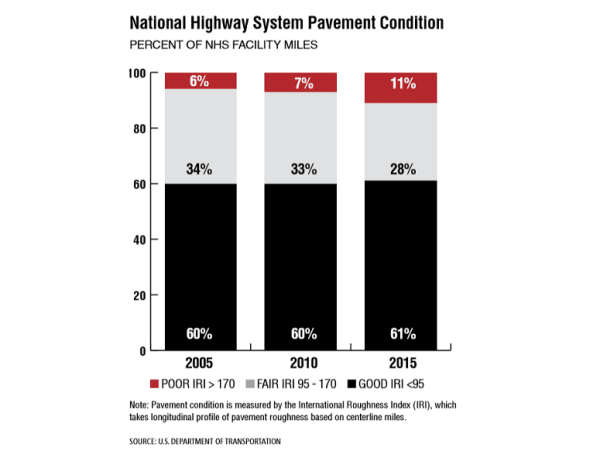
Note: Pavement condition is measured by the International Roughness Index (IRI), which takes longitudinal profile of pavement roughness based on centerline miles.
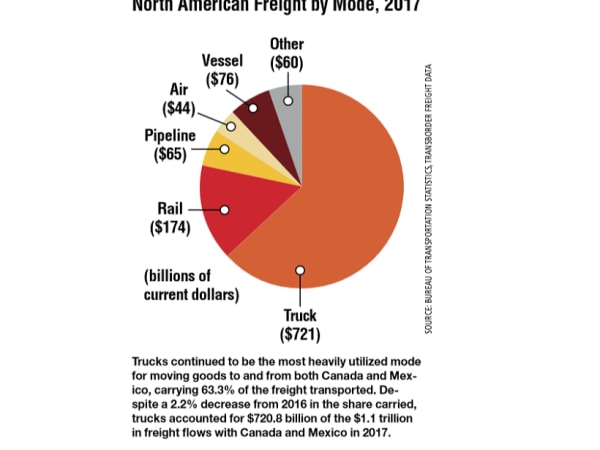
Trucks continued to be the most heavily utilized mode for moving goods to and from both Canada and Mexico, carrying 63.3% of the freight transported.
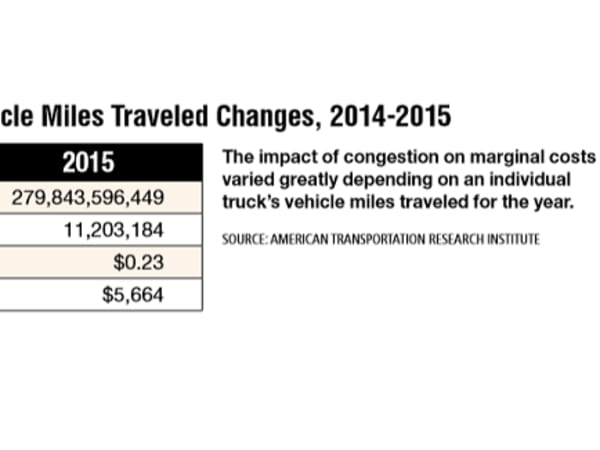
The impact of congestion on marginal costs varied greatly depending on an individual truck’s vehicle miles traveled for the year.
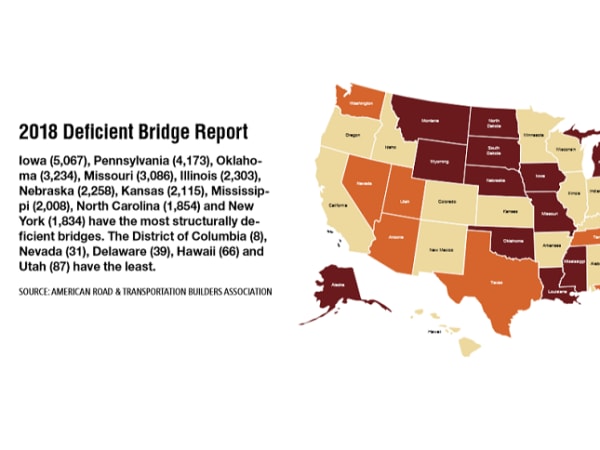
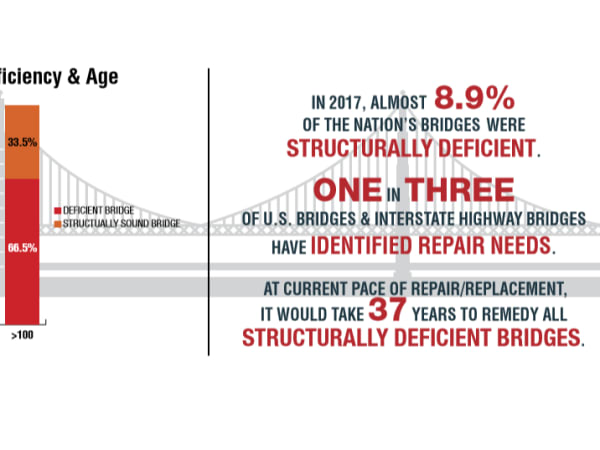
Iowa, Pennsylvania , Oklahoma, Missouri, Illinois, Nebraska, Kansas, Mississippi, North Carolina and New York have the most structurally deficient bridges.
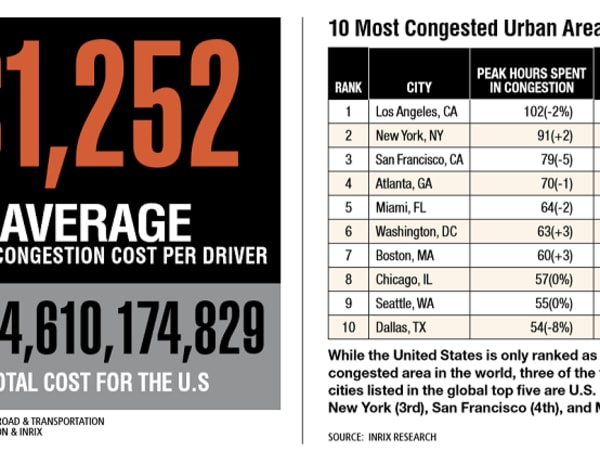
While the U.S. is only ranked as the fourth most traffic congested area in the world, three of the top five most congested cities listed in the global top five are U.S. cities.