



U.S.-NAFTA Trade Increases, Trucks Gain Most of Any Mode
Two of five transportation modes, truck and pipeline, carried more U.S.-North American Free Trade Agreement freight in February 2014 than compared to the same time a year earlier, according to new U.S. Transportation Department figures.
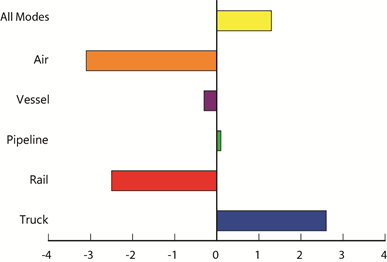
Percent Change in Value of U.S.-NAFTA Freight Flows by Mode: February 2013 - February 2014. Credit: U.S. DOT
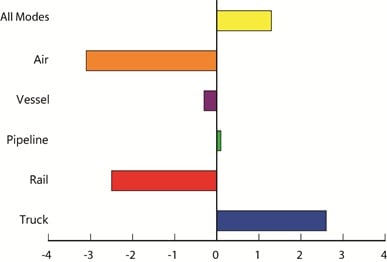
Percent Change in Value of U.S.-NAFTA Freight Flows by Mode: February 2013 - February 2014.
U.S. DOT
Two of five transportation modes, truck and pipeline, carried more U.S.-North American Free Trade Agreement freight in February 2014 than compared to the same time a year earlier, according to new U.S. Transportation Department figures.
Trade using truck grew the most of any mode, 2.6%, as the value of overall U.S. trade with its NAFTA partners Canada and Mexico, rose 1.3% from year-to-year, following a 0.2% drop in January. Pipeline rose just 0.1% during February.
Trade using other modes fell 0.6% from year-to-year. Air declined 3.1%, rail fell 2.5% and vessel dropped 0.3%.
While the value of freight carried by rail decreased from year-to-year, it was still the second largest mode, with a 14.7% share, followed by vessel at 9.6%, pipeline at 7.6% and air at 3.5%. The surface transportation modes of truck, rail and pipeline carried an 82.2% share of the total NAFTA freight flows.
Trade with Canada
In February, compared to the same time in 2013, the value of U.S.-Canada trade by vessel increased the most of any mode, growing 17.6%, due to an increase in exports of mineral fuels, while U.S.-Canada trade by pipeline decreased by 1.1%.
Truck carried 54.4% of the $48.9 billion of freight to and from Canada, followed by rail at 15.6%, pipeline at 13.2%, vessel at 6.2% and air at 4.2%. The surface transportation modes of truck, rail and pipeline carried 83.1% of the total U.S.-Canada freight flows.
The top commodity category transported between the U.S. and Canada was mineral fuels, of which $6.4 billion, or 56.3% was moved by pipeline.
Trade with Mexico
Year-to-year, the value of trade with Mexico by pipeline increased the most of any mode, growing 25.5%, but pipeline trade remained less than 1% of total U.S.-Mexico trade. Trade using rail rose 7.1% while truck freight increased 5.2%. Freight moved by vessel declined 7.9% and air freight fell 2%.
Truck carried 66.4% of the $40.7 billion of freight to and from Mexico, followed by vessel at 13.7%, rail at 13.7%, air at 2.7% and pipelines at 0.9%. The surface transportation modes of truck, rail and pipeline carried 81% of the total U.S.-Mexico freight flows.
The top commodity category transported between the U.S. and Mexico in February 2014 was electrical machinery, of which $6.3 billion, or 91.4% was moved by truck.
More Fleet Management
Why Private Fleets Are Taking More Freight
Private fleets are putting their own trucks on demanding customers and high-cost lanes as companies seek greater control over service, costs, and capacity.
Read More →
Color Match Smarter: Tools That Restore & Perform
For fleet managers and collision repair professionals keeping heavy-duty trucks on the road, getting the color right the first time isn't just about appearance — it's about efficiency, turnaround time, and bottom-line results. Discover how today's digital color tools are transforming the repair process from guesswork to precision.
Read More →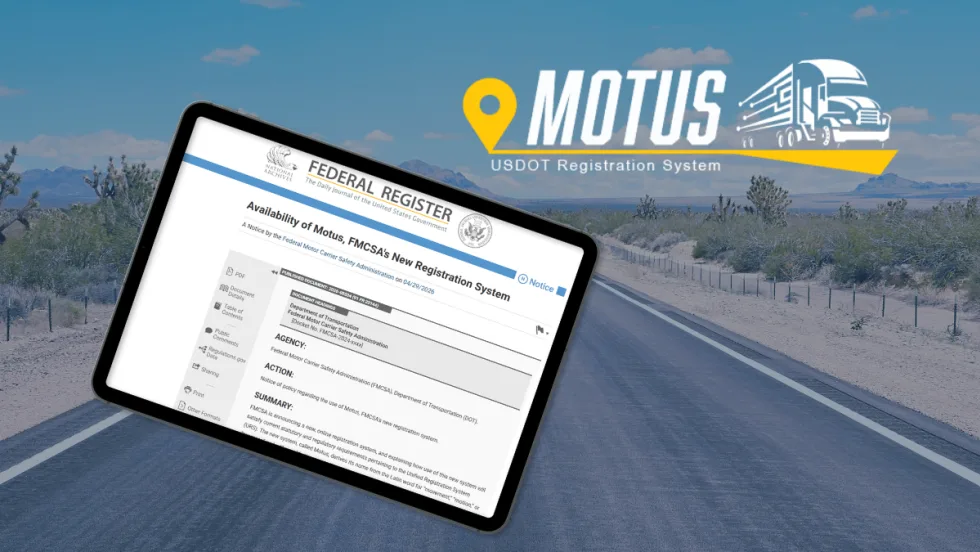
FMCSA Pauses Biennial-Update Enforcement Amid Motus Transition
Carriers whose updates were due on or after June 1 have more time, while FMCSA works to stabilize its new registration system and warns of phishing sites impersonating its new carrier registration system, Motus.
Read More →
2026 Blueprint for Countering Smarter Supply Chain Theft
Cargo theft is no longer just the cost of doing business. It's a multi-billion-dollar criminal enterprise exploiting vulnerabilities across your fleet, drivers, and supply chain.
Read More →
How Telematics Improves Visibility, Control, and Performance in Refrigerated Fleets
Explore how telematics help refrigerated fleets improve visibility, uptime, efficiency, compliance, and cargo protection across connected cold chain operations.
Read More →
What the U.S.-Canada Trade War Means for Trucking
Escalating U.S.-Canada tariffs could disrupt cross-border freight, reduce truck volumes, raise costs, and create new uncertainty for carriers on both sides of the border.
Read More →
What Are Trucking’s Top Concerns for 2026?
The American Transportation Research Institute wants to know what's worrying trucking fleet managers, drivers, and other stakeholders in its annual Industry Issues survey.
Read More →
American Trucking Associations Looks for a New Leader
ATA President and CEO Chris Spear abruptly left his job at the association on August 21, at a pivotal time for the trucking industry.
Read More →
Public Wi-Fi Cybersecurity Risks: How Truck Drivers and Fleets Can Protect Their Data
Public Wi-Fi can expose truck drivers and fleets to credential theft, malware, and other cyber threats. Here’s how to reduce the risk on the road.
Read More →
For Nicky Cupp, Fleet Innovation Starts With Frustration
HDT Truck Fleet Innovator Nicky Cupp turns everyday pain points at Fraley & Schilling into opportunities for better technology and smarter processes.
Read More →