

Bridge Report Finds Nearly 56,000 Bridges Still Need Attention
The U.S. Department of Transportation has released the 2016 National Bridge Inventory, which indicates that 55,710 bridges are structurally compromised-- including 13,000 that need replacement, widening, or major reconstruction.
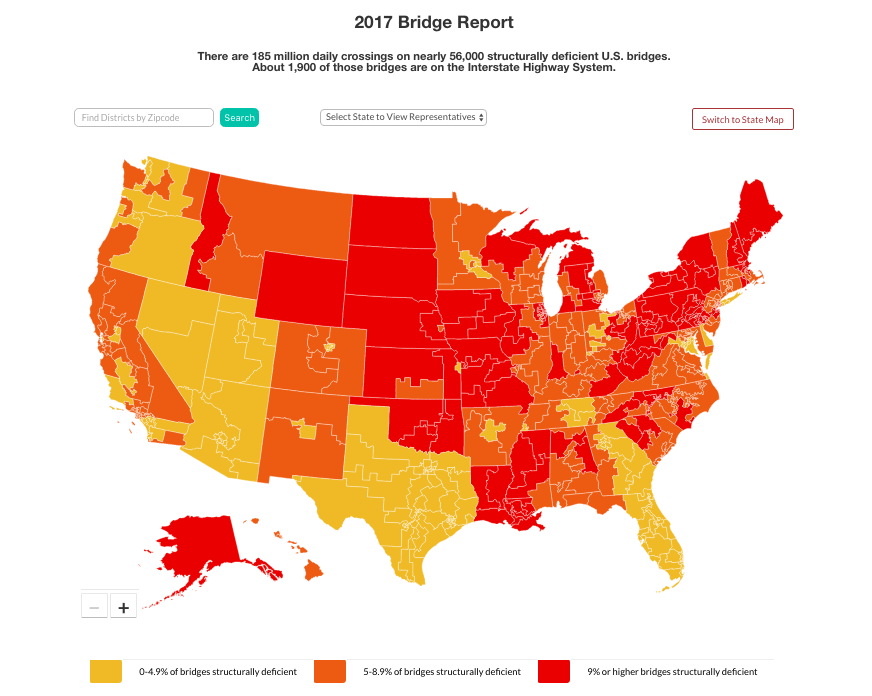
The American Road & Transportation Builders Association published an interactive map showing the states with the highest percentage of structurally deficient bridges. Source: ARTBA

The U.S. Department of Transportation has released the 2016 National Bridge Inventory, which indicates that 55,710 bridges are structurally compromised-- including 13,000 that need replacement, widening, or major reconstruction.
The information was analyzed by the American Road & Transportation Builders Association. The information was compiled into ARTBA's 2017 Bridge Report.
The report is produced annually and by comparing 2016 to 2015’s National Bridge Inventory, ARTBA found that progress has been slow in repairing bridges.
The inventory of structurally deficient bridges only decreased by 0.5% in a year's time. At that pace, it would take more than 20 years to address all of the problems structures.
“America’s highway network is woefully underperforming. It is outdated, overused, underfunded and in desperate need of modernization,” said Alison Premo Black, chief economist of ARTBA. “State and local transportation departments haven’t been provided the resources to keep pace with the nation’s bridge needs.”
About 1,900 of the bridges are on the Interstate Highway System, affecting millions of Americans. The nation’s cars, trucks, and buses cross the 55,710 bridges around 185 million times every day. While these bridges may not be imminently unsafe, their inclusion in the U.S. DOT report indicates that they are in need of attention.
The ARTBA report is presented through an interactive map of the United States, in which each state is color-coded based on the percentage of structurally deficient bridges it contains. By clicking on a state, a separate report on the state can be accessed, breaking down the breadth of the problem as well as the locations of each bridge.
Iowa was the state with the highest number of structurally deficient bridges at 4,968, while Rhode Island was the state with the highest percentage at 25%. Washington D.C. contained the least deficient bridges of the regions tracked with only 9, while Nevada was the state with the least at only 31.
The 2017 Bridge report also offers specific information, including rankings of the 250 most heavily travelled structurally deficient bridges in the nation and the 25 most heavily traveled in each state.
To access the report, click here.
More Fleet Management
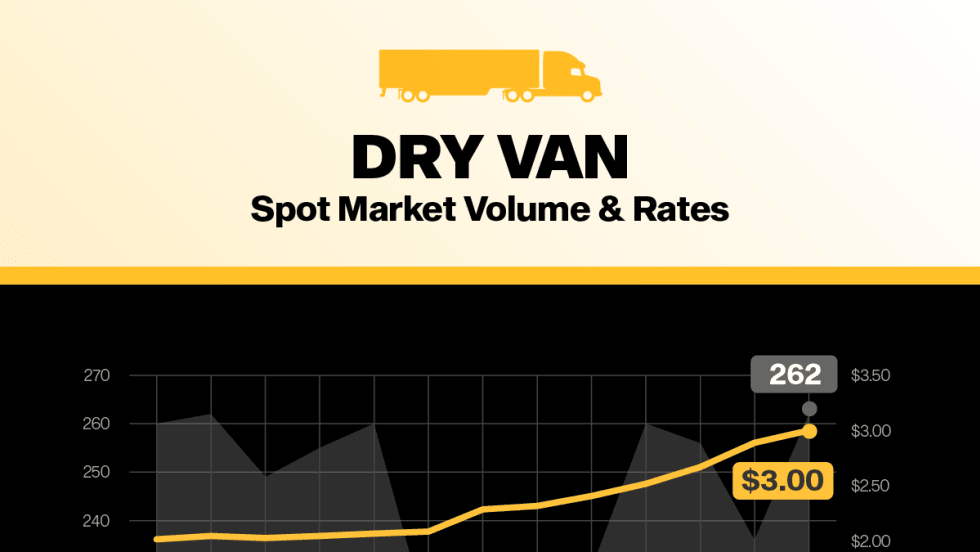
Van Spot Rates Top Contract Rates for First Time Since 2022
There’s more good economic news for the North American trucking industry according to the latest Truckload Volume Index report from DAT.
Read More →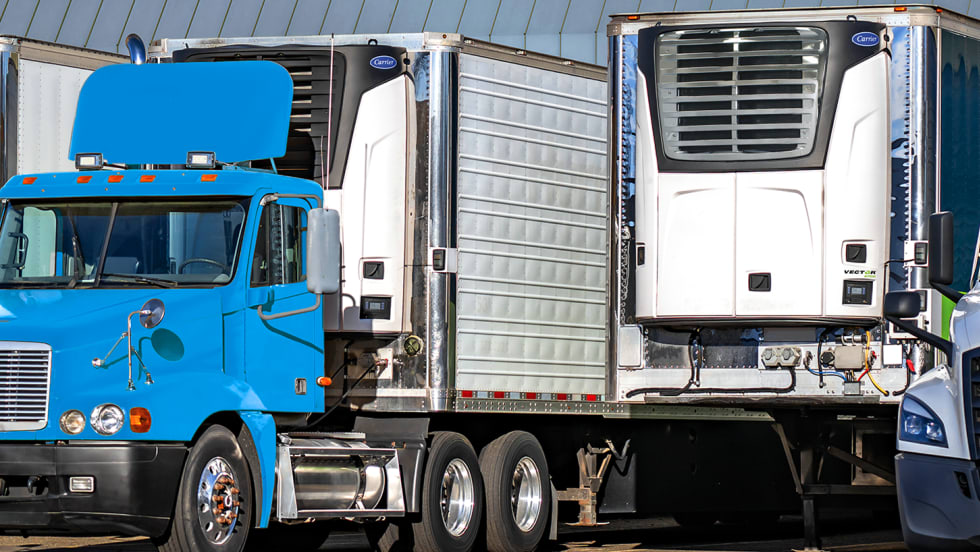
Carrier Transicold Extends Refrigerated Trailer Life
Fleet Refresh enables refrigerated fleets to replace aging transport refrigeration units instead of entire trailers, while adding Lynx Fleet telematics and BluEdge service coverage.
Read More →
FTR Says Freight Rates Surged in May
FTR's Trucking Conditions Index surged to a record high in May, the analytics firm reports.
Read More →

Meet HDT's Truck Fleet Innovators at Heavy Duty Trucking Exchange
Heavy Duty Trucking Exchange brings fleet managers and suppliers together for the deeper conversations that lead to ideas, partnerships, and solutions. Time is running out to apply for HDTX, September 23-25.
Read More →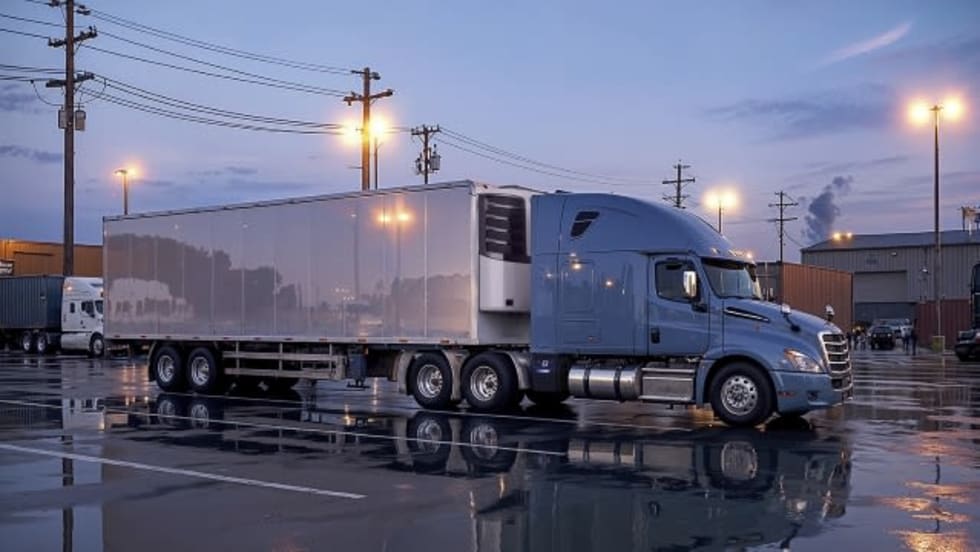
Enhance Fleet Performance with High-Efficiency Auxiliary Power Units
Drive sustainable cost savings while increasing driver comfort during short- and long-haul logistics operations.
Read More →
Is Your Parts Procurement Process Reactive or Proactive?
Ready to revamp your parts procurement process? Learn how now with “Strategic Parts Purchasing: A Process Checklist”
Read More →
What Trucking Events are Happening in 2026?
Looking for trucking-related conventions, expos, and other events? Heavy Duty Trucking has developed this list of national and larger regional trucking shows and events.
Read More →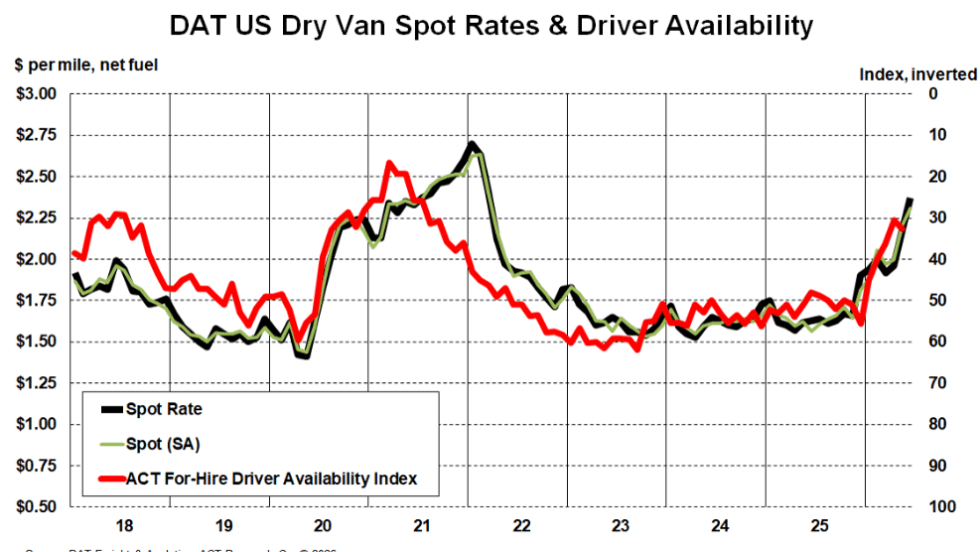
Truckload Rates Keep Rising as Tight Capacity Fuels Freight Market Recovery
Spot and contract rates continued climbing in May and June, not because freight demand is surging, but because fewer trucks and drivers are available.
Read More →
What Geotab's New AI Connector Means for Fleets
Fleets can now ask their usual AI assistants questions about maintenance, safety, fuel use, and vehicle performance, using their live Geotab data, and take action on the answers without leaving their preferred AI tool.
Read More →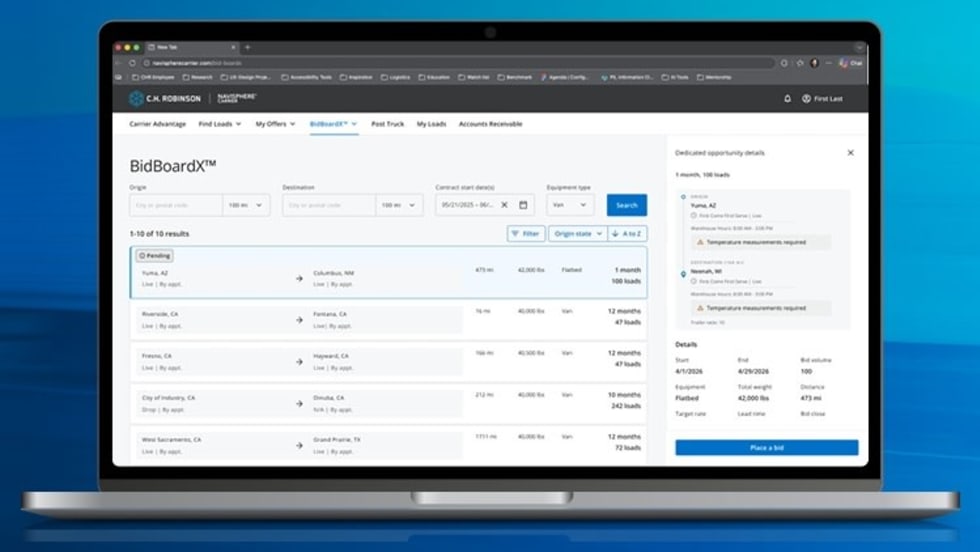
New C.H. Robinson Tool Opens Door to More Predictable Freight
BidBoardX lets carriers search, bid on, and secure committed freight opportunities through a single digital marketplace.
Read More →