

Engineers Give America's Infrastructure a D+
The American Society of Civil Engineers says the state of America's infrastructure rose slightly, going from a D in 2009 to a D+ in its 2013 Report Card for America's Infrastructure, and projected a $1.5 trillion funding shortfall by 2020 based on current funding levels.

The American Society of Civil Engineers says the state of America's infrastructure rose slightly, going from a D in 2009 to a D+ in its 2013 Report Card for America's Infrastructure, a comprehensive assessment of the nation's infrastructure across 16 sectors.
Updated once every four years, this year's Report Card found that America's cumulative GPA for infrastructure rose slightly to a D+ from a D in 2009. The Report Card estimates total investment needs at $3.6 trillion by 2020 across all 16 sectors, leaving a funding shortfall of $1.6 trillion based on current funding levels.
The grades in 2013 range from a high of B- for solid waste infrastructure to a low of D- for inland waterways and levees. Encouraging trends were found in sectors where focused investments were made, including roads and bridges. America's rail sector saw the largest improvement, moving from a C- to a C+.
Key trends driving improvements included:
Renewed efforts in cities and states to address deficient roads, bridges, drinking water, and wastewater systems;
Private investment for efficiency and connectivity brought improvements in the nation's railways, ports, and energy grid;
Several categories benefited from short-term boosts in federal funding.
Bridges got a C+. Over 200 million trips are taken daily across deficient bridges in the nation’s 102 largest metropolitan regions. In total, one in nine of the nation’s bridges are rated as structurally deficient, while the average age of the nation’s 607,380 bridges is currently 42 years. The Federal Highway Administration estimates that to eliminate the nation’s bridge deficient backlog by 2028, we would need to invest $20.5 billion annually, while only $12.8 billion is being spent currently.
Roads, however, got a D. The report notes that 42% of America’s major urban highways remain congested, costing the economy an estimated $101 billion in wasted time and fuel annually. While the conditions have improved in the near term, and Federal, state, and local capital investments increased to $91 billion annually, that level of investment is insufficient and still projected to result in a decline in conditions and performance in the long term. Currently, the Federal Highway Administration estimates that $170 billion in capital investment would be needed on an annual basis to significantly improve conditions and performance.
For the first time, the 2013 Report Card includes information for all 50 states and highlights initiatives and innovations that are making a difference. For example, Oklahoma created a plan to replace or rehabilitate over 950 structurally deficient bridges between 2013 and 2020.
Click here to view Report Card grades for specific infrastructure sectors.
For the first time, the Report Card is available as a digital application that includes videos, state by state data, and other multimedia tools. Available for download from iTunes and Google Play, the app is supported across all major platforms and devices. It is also accessible online at www.infrastructurereportcard.org, and is supported across all major platforms and devices.
More Drivers
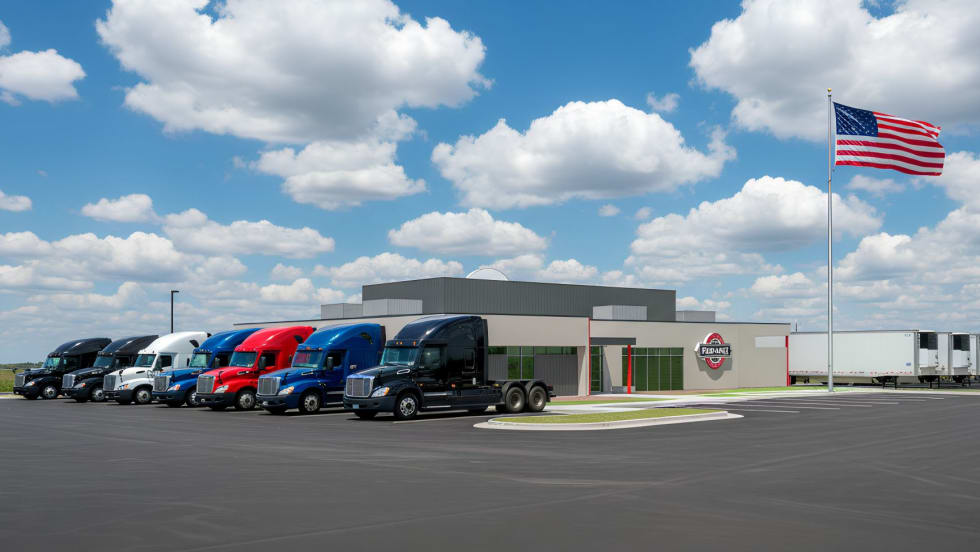
Prime Inc. to Open $7.9M Flagship Used-Truck Dealership
A new driver-focused facility to sell Prime Inc's used trucks and trailers will be the first purpose-built location in the company's history.
Read More →
Short Takes: Inside K&B’s Truck Safety Tech
Listen to learn how K&B Transportation uses cellphone-blocking technology, speed management systems, weather geofencing, bridge avoidance tools, and more to improve driver safety.
Read More →
Nussbaum Expands Driver Compensation with Pay Raises, Profit Sharing
Nussbaum Transportation said its latest compensation package could push first-year driver earnings above $90,000 in key hiring markets.
Read More →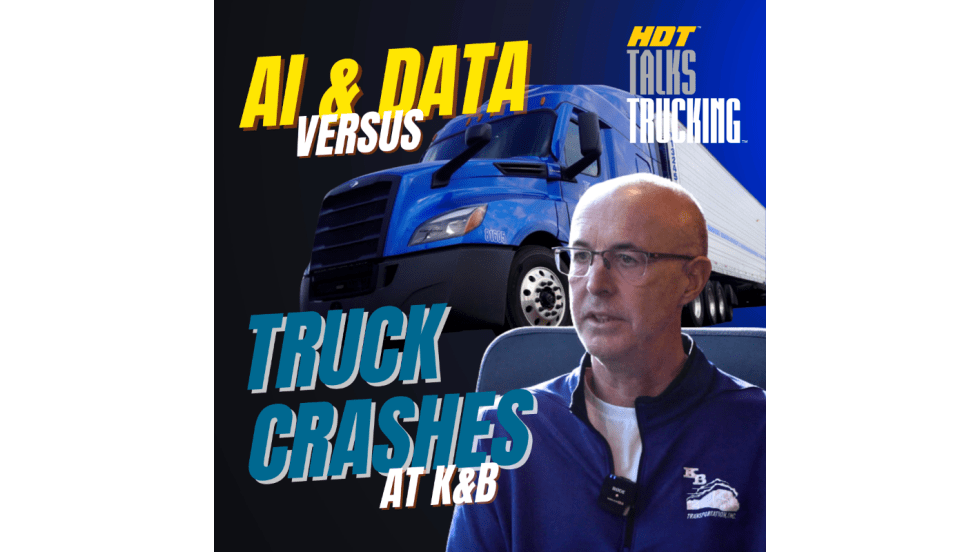
Listen: Inside Modern Fleet Safety: AI, Cameras & Speed Control at K&B Transportation
Fleet safety is evolving fast—and technology is at the center of it. Learn how a former commercial vehicle enforcement officer turned director of safety at K&B Transportation is embracing real-world safety technology.
Read More →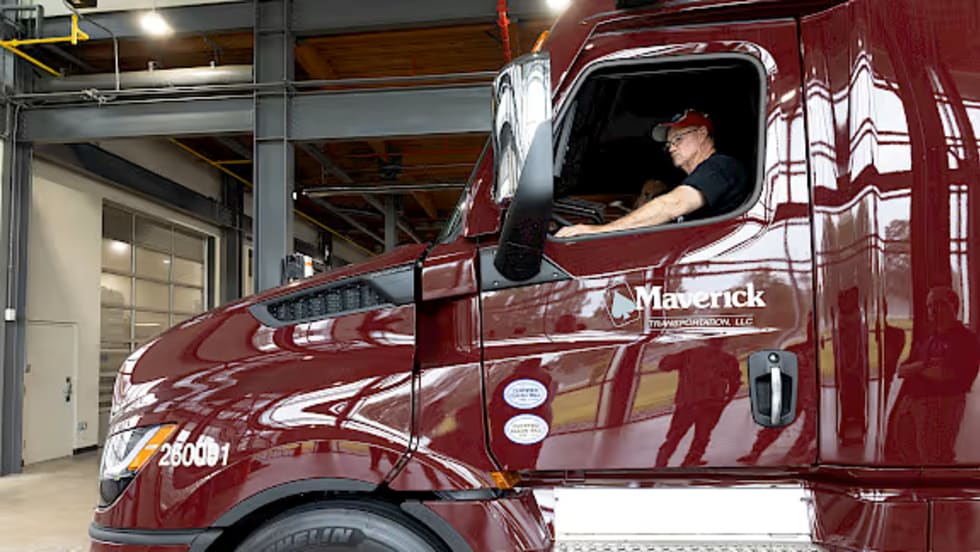
Maverick Announces 2026 Driver Pay Raises
New raises for Maverick Transportation drivers will take effect on May 31, 2026.
Read More →
Illinois Trucker Indicted for Nearly $22,000 in Ohio Turnpike Toll Evasion
Authorities say an Illinois trucker avoided paying tolls for two years, and now faces felony charges, possible prison time, and forfeiture of his Freightliner tractor.
Read More →
New Trojan Driver Cargo Theft Scam Bypasses Carrier Vetting Systems
Cargo theft rings plant operatives as drivers inside legitimate, fully vetted carriers, then execute coordinated thefts that look like a traditional straight theft from the outside.
Read More →
WIM, Trucker Path Name Top 3 Women-Friendly Truck Stops
ATA’s Women In Motion Council and Trucker Path highlight three truck stops that meet all seven safety-focused criteria and rank highest among female drivers.
Read More →
FMCSA Extends Paper Medical Card Exemption … Again
Five states still aren't ready to accept commercial driver medical exam information directly from the medical examiner's registry.
Read More →
Mack Launches Digital Driver Guide for Chassis-Specific Truck Info
Mack’s new, virtual owner’s manual delivers VIN-based, on-demand guidance for vehicle systems via web, app, and soon in-cab displays.
Read More →