

The Challenge of Standardizing Aerodynamic Testing
Aero device manufacturers now have a choice of test methods to prove the effectiveness of their devices. Are consumers any better off?

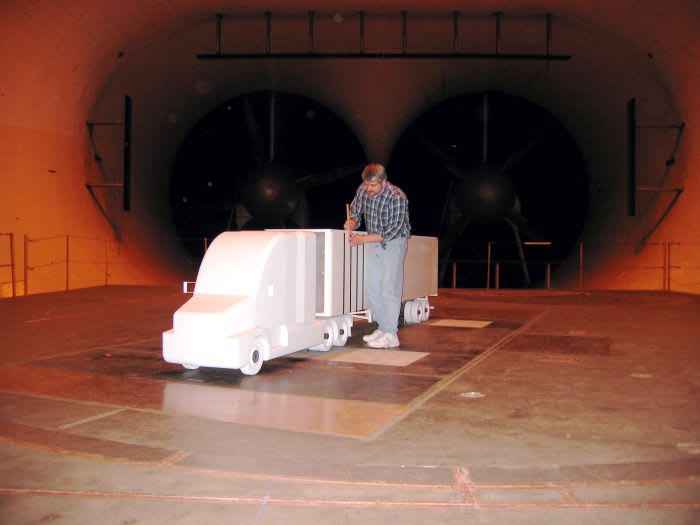
One of the new testing methods allowed for EPA SmartWay verification is wind tunnel testing. Here a scale model is prepped carefully before the test; small irregularities can make a big difference in the outcome.

Trying to standardize evaluations of aerodynamic devices is challenging. On one hand, you have to establish testing methods that will yield results consumers can have faith in. On the other hand, consumers need to recognize that the results of standardized tests may not reflect their operational realities.
Somewhere in the middle lies the U.S. Environmental Protection Agency’s SmartWay Trailer and Aerodynamic Device Program.
Until recently, trailer aero technology suppliers had to use a version of the Society of Automotive Engineers’ J1321 track test to have their product accepted and verified by SmartWay. Now they have a choice of three methods, each with its own benefits and challenges. Fleets may have to accept data from test methods that may favor certain devices, or place their faith in “fuel savings” numbers that are mathematically derived from a series of very complex calculations rather than direct fuel-used comparisons between test and control vehicles.
“It’s a difficult situation for EPA,” says Rick Mihelic, a retired manager of vehicle performance and engineering analysis with a major OEM. “Marketplaces want simple answers to hard questions. When those simpler answers are provided, they sometimes get abused for not being accurate.”
Mihelic cites a former California-based customer whose operation was not remotely similar to the test protocol and was disappointed in the performance of the trailer skirts it purchased.
The test measured fuel use differences from a pair of test vehicles tested at 60 or 65 mph. In California, he explains, “average truck speeds are capped at 55 mph and average speeds with traffic conditions and secondary road operations can be as low as 40 mph. The quoted savings was applicable to the test conditions, but did not simulate the customer’s specific actual operations.”
SmartWay’s new testing and reporting protocols (see page 72) may prove too simple for the marketplace, but at the same time, they will be technically challenging for manufacturers.
SmartWay now displays verified devices in a table rather than a list. The table lists the device in a certain performance “bin,” and it also shows the method used to test the device with a check mark in the appropriate column. The table will show a star to indicate if the device’s performance was also tested using an optional second test method.
“Suppliers now have the option, and we certainly hope there is an incentive, to test the same device or combination of devices using multiple test methods,” says Sam Waltzer, an environmental engineer at EPA and SmartWay’s Technology Team leader for heavy trucks.

So far, so good. Providing data from two test methods should help inspire confidence in the results at the consumer level – if the suppliers decide to shell out $20,000 to $40,000 for two separate tests. At press time, none of the products on the SmartWay Verified Aerodynamic Devices table showed results from the optional secondary test.
SmartWay is working on testing protocols for four testing options: SAE J1321 Type II track test (SmartWay modified 2012 version), coast-down, wind tunnel, and computational fluid dynamics (CFD). The CFD method will not be allowed as a primary SmartWay verification test but can be used to provide that secondary, optional data.
The actual SmartWay protocols are not yet posted on the program’s website, but generally speaking, here are the pros and cons of the various test methods.
For better or worse

The J1321 track test is the only test that gives you an actual fuel-consumed value, while trying to eliminate or isolate as many variables as possible that could impact the test. These would include unforeseen winds, track geometry, and/or truck-specific factors. Properly notated, the results of a J1321 test would give you a percent of fuel saved number, say 5% with a confidence interval (also known as uncertainty value or margin of error), of, for example, plus or minus 1.5%. (Read part one in the March issue for more on confidence intervals/uncertainty values.)
In coast-down, CFD and the wind tunnel, fuel saved can only be a calculated value based on the reduction in drag demonstrated by the device(s) on a test truck or model. The confidence interval is much harder to calculate.
According to Kevin Cooper, president of CooperAero Ltd. and a former wind tunnel technician and engineer with Canada’s National Research Council wind tunnel programs in Ottawa, Ontario, this does offer the advantage of being able to average the drag curve in a way that should represent a truck’s exposure to North American average wind conditions.
“That won’t be anybody’s actual number necessarily, but that gives you a better number in a way, and everything is weighted the same,” he points out. “It’s like the EPA’s track test number; no one ever gets that on the road, but it’s usually a good indicator of what’s better is better and what’s poorer is poorer.”
If there’s a problem with the wind tunnel, it’s calculating the percent-fuel-savings figure. It will be a calculated value, and therefore influenced by the variables in the testing process.
“Wind tunnel testing gives you an aerodynamic term, a drag coefficient,” explains Richard Wood, past chairman of the Society of Automotive Engineers’ Truck and Bus Aerodynamic and Fuel Economy Committee. “It’s done in a laboratory environment where you have a high degree of repeatability, but getting the fuel-saved number requires some very complex calculations. It also fails to provide a confidence interval, that plus-or-minus value that tells you how trustworthy the fuel-saved figure really is.”
Coast-down testing, like the J1321 Type II test, is done outdoors, so it’s subject to environmental factors like wind. These can be controlled for. The track is critical as well, in that the test portion must be completely flat and straight, as both can affect the test.
In a coast-down test, the test truck is run at a predetermined speed, usually 65 mph, and on a straight, flat section of track, the truck is placed in neutral and allowed to coast down to some predetermined speed. Measurements are taken to determine the relative impact of rolling resistance and mechanical drag (usually constant) and aerodynamic drag (variable with speed). The test requires 20-30 runs and each is measured, compared and averaged along a curve.

“What it gives you is a ‘road load’ number, which is rolling resistance, mechanical resistance and aerodynamic resistance,” Wood says. “In coast-down testing you measure a total number and then through mathematics and assumed relationships you try to pull out an aerodynamic number.”
According to Wood, coast-down was developed for the automobile industry as way to prove that data collected in a wind tunnel using scale models could be correlated to real-world car-on-the-road effects of aerodynamic drag.
“The coast-down tests provide comparisons that could be mathematically manipulated to relate to wind tunnel test data,” he says. “But is doesn’t transfer easily to trucks because of the complexity of their shape.”
The other problem with coast-down is that it cannot be used to generate comparative data. Every other procedure allows you to calculate an uncertainty, so you can do a direct comparison. But coast-down does not allow that. A coast-down test gives you one result for one vehicle for one test.
CFD testing is also on SmartWay’s radar screen, but it has some challenges and limitations as well.
“I know EPA is talking about it, but I think it’s going to take a long time before they get there,” says one testing expert we spoke to who did not want his name used. “They are going to need to establish a protocol for everyone to follow so that the results can be compared objectively.”
He describes CFD as like watching a test in real time; you see a cycle that’s always moving.
“The question is, where do you stop the cycle to get some sort of result?” he asks, adding, “EPA will have to establish some way to interpret the results.”
CFD is highly repeatable, but it’s still a computer simulation. It’s based on certain data inputs and calculations along with a huge number of assumptions about how the truck performs in air and how air behaves around a moving truck – with all its complex shapes, like mirrors, grilles, engines, and air flow under the hood and around the undercarriage. Not that the process is prone to error, but errors can be built into the simulation in the way the problem is set up.
“What CFD gives you is a coefficient of drag, which then has to be rendered into a fuel saved number,” Wood says. “That requires extensive calculations based on engine maps, tire rolling resistance and other factors.”
So there you have it, an over-simplified assessment of the pros and cons of the testing procedures and protocols we expect to see someday soon from the EPA’s SmartWay Trailer and Aerodynamic Device Program.
More Fuel Smarts

Cummins Adjusts 2027 Engine Rollout After EPA Proposal
The engine maker will gradually introduce its new Model Year 2027 diesel engines while continuing to offer current models during the transition, citing the EPA's proposed emissions rule changes.
Read More →
EPA Proposal Could Ease 2027 Truck Costs and Buying Uncertainty
The proposal doesn't change the tougher NOx standard, but it would revise key implementation requirements that manufacturers say have driven up costs and complicated fleet purchasing decisions.
Read More →
Cummins, Paccar Ease DEF Derates After EPA Guidance
Updated diesel engine software gives truck operators more time to address emissions-system issues while staying compliant with EPA emissions standards.
Read More →
Maintenance in the Messy Middle Part 3: Biodiesel
Biodiesel can reduce emissions, improve fuel-system lubricity and use existing diesel infrastructure. But NACFE’s Messy Middle maintenance report says fleets must actively manage storage, cold-weather operation, filters and oil drain intervals to avoid problems.
Read More →
Enhance Fleet Performance with High-Efficiency Auxiliary Power Units
Drive sustainable cost savings while increasing driver comfort during short- and long-haul logistics operations.
Read More →
Maintenance in the ‘Messy Middle’ Part 2: Renewable Diesel Fuel
NACFE's latest Messy Middle Powertrain Service & Maintenance report says renewable diesel gives fleets an opportunity to reduce carbon emissions without changing trucks, fueling infrastructure or maintenance practices. But technicians still need to understand several important operational differences.
Read More →
The Diesel Engine Enters NACFE’s ‘Messy Middle’
NACFE’s new Messy Middle Powertrain Service & Maintenance report says keeping modern diesel engines running now depends as much on software, diagnostics and data as traditional mechanical service.
Read More →
DTNA Software Update Gives Truckers More Time Before DEF Derates Take Effect
The changes reflect EPA guidance aimed at reducing downtime caused by emissions-system faults while maintaining compliance requirements.
Read More →
New Agentic Predictive Maintenance Report Demonstrates How Degraded Aftertreatment Systems Waste Fuel
Questar analyzed a large mixed-class fleet and discovered it was wasting as much as $30 in fuel per vehicle, per day, because of mechanically degraded aftertreatment systems.
Read More →
New York City's Microhub Project is Delivering Results
Trucking, last-mile delivery companies, and environmental advocates like what they are seeing so far with New York's microhub program.
Read More →