


After setting a new record high, a monthly gauge of freight moved by the nation’s for-hire transportation industry retreated, according to new Transportation Department figures.
After setting a new record high, a monthly gauge of freight moved by the nation’s for-hire transportation industry retreated, according to new Transportation Department figures.

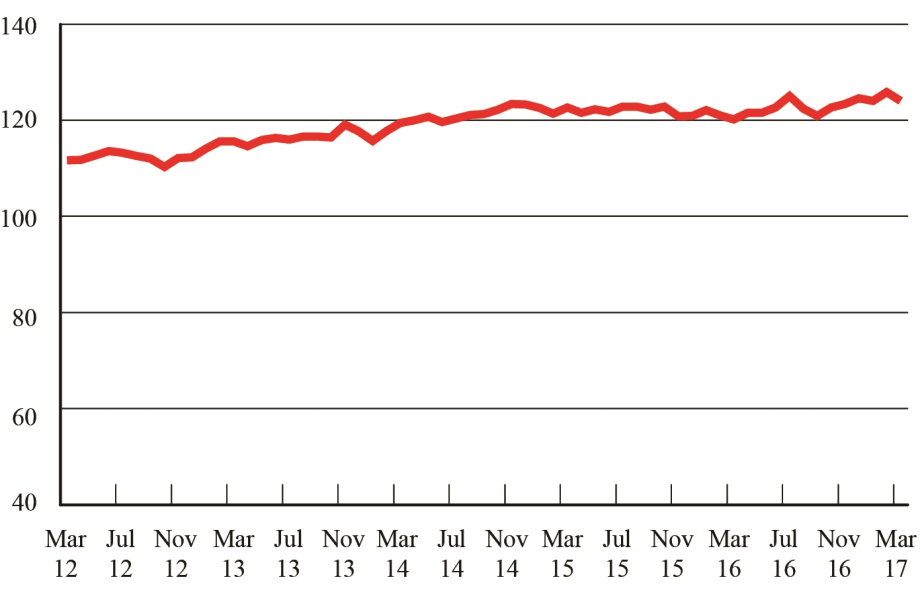
Freight Transportation Services Index, March 2012 - March 2017. Graphic: U.S. DOT
After setting a new record high, a monthly gauge of freight moved by the nation’s for-hire transportation industry retreated, according to new Transportation Department figures.
Freight Transportation Services Index (TSI) fell 1.5% in March from the month before, after reaching an all-time high in February. The March index level registered 124 while the February reading was revised downward to 125.9 from 126.4, still a record, as January was revised up slightly.
When the level of March is compared to the same time in 2016, it is up 3.2%.
The Freight TSI measures the month-to-month changes in for-hire freight shipments by mode of transportation in tons and ton-miles, which are combined into one index. The index measures the output from trucking, rail, inland waterways, pipelines and air freight.
The March decline was due to decreases in trucking, rail carloads, rail intermodal, and water, while air freight and pipeline grew. It took place against a background of mixed signals in other economic indicators that showed employment and personal income grew while housing starts declined. Also, a measure of industrial production rose by 0.5% in March, but this was entirely due to growth in utilities, as manufacturing output declined.
The 0.5% first quarter decrease in the freight TSI from the previous quarter took place as gross domestic product growth slowed to an annual rate of 0.7% from 2.1% in fourth quarter 2016,
The slowdown in GDP growth in the most recent two quarters was preceded by a third quarter decline in Freight TSI and the rapid GDP growth in the third quarter was preceded by a 2.1% increase in Freight TSI in the second quarter.
Despite these recent economic trends, the freight TSI remains at a historically high level. For all four months from December 2016 through March 2017, it was above the level for all previous months.
The decline in the freight TSI during the first quarter of 2017 was the sixth quarterly decline out of the nine quarters since December 2014. Despite the quarterly declines, the index is 0.6% above the level of December 2014.
According to the Transportation Department, research has shown a clear relationship between economic cycles and the Freight TSI.
C.H. Robinson is waiving fees on fuel cards and cash advances for April and May, aiming to help carriers offset rising diesel costs tied to geopolitical instability.
Read More →
Looking for trucking-related conventions, expos, and other events? Heavy Duty Trucking has developed this list of national and larger regional trucking shows and events.
Read More →
After years of steady, methodical progress, Peter Voorhoeve says the OEM’s latest lineup isn’t just evolutionary. It’s delivering real, measurable gains for fleets right now.
Read More →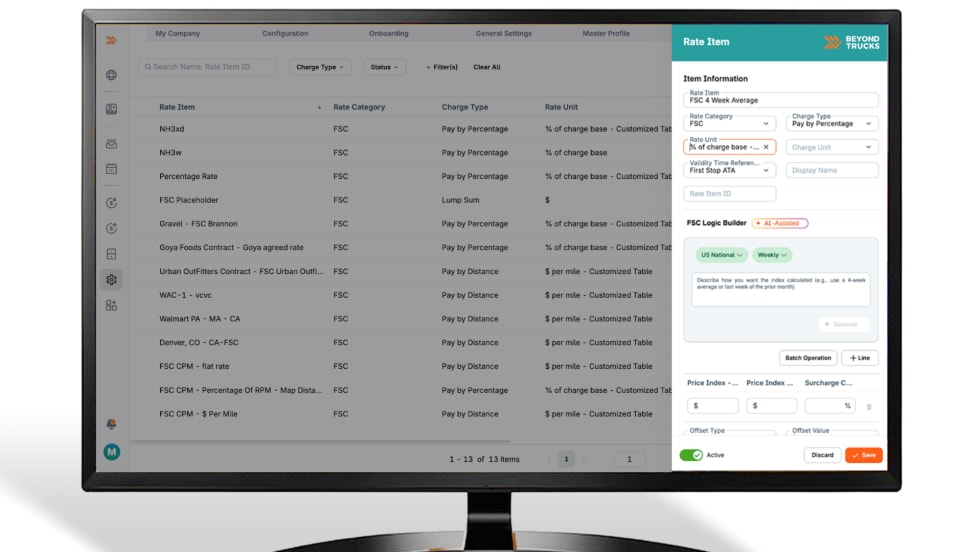
BeyondTrucks says its new RateAgents can turn plain-language rate logic into working code, starting with fuel surcharges — a critical but notoriously complex piece of carrier revenue.
Read More →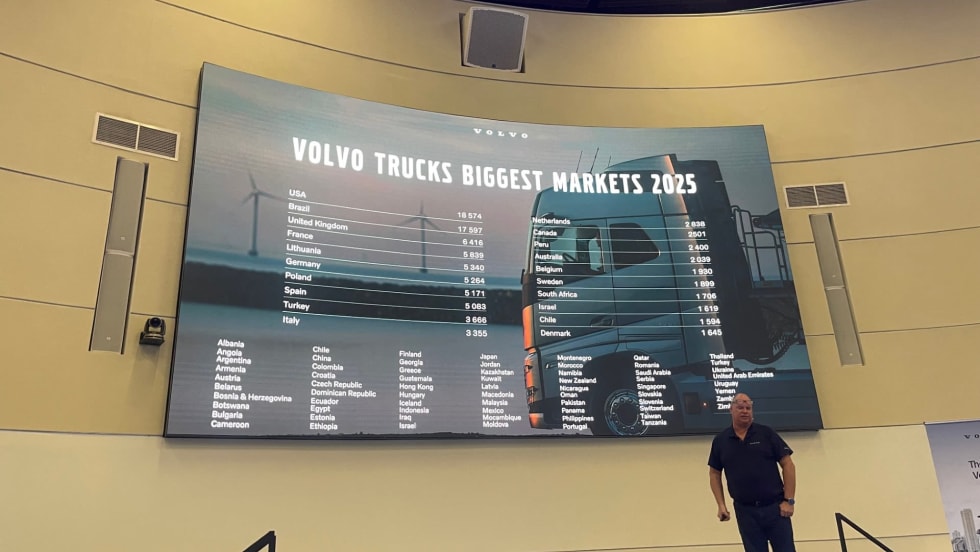
Soft freight conditions persist, but aging fleets, strong order intake, and new-product momentum signal a more optimistic second half of 2026, Volvo Trucks North America says.
Read More →
Cargo theft is evolving from regional smash-and-grab operations to sophisticated fraud schemes. Strategic theft now accounts for roughly a third of cargo crime, with incidents rising sharply in recent years. Here’s how the schemes work — and what fleets can do to protect themselves.
Read More →
Heavy Duty Trucking's Top 20 Products awards recognize the best new products and technologies. Check out the award presentations at the 2026 Technology & Maintenance Council annual meeting.
Read More →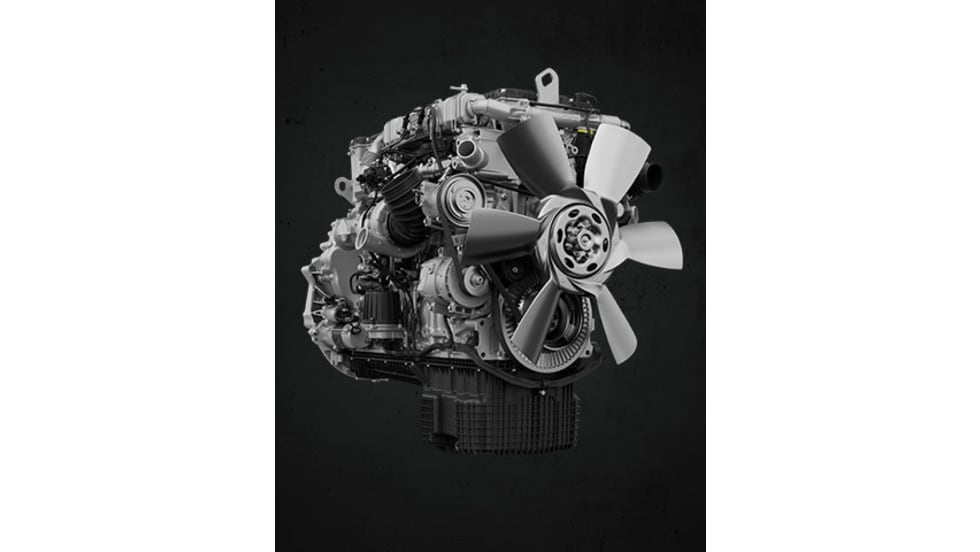
The Detroit® Gen 6 engine platform proves that real progress doesn’t require a complete redesign. Built on 20 years of trusted technology, these engines are designed for efficiency, stronger performance, and greater reliability than before. And they do it all while complying with 2027 EPA standards on every mile.
Read More →
The 2026 ACT Expo is focusing heavily on what organizer Erik Neandross calls trucking's digital frontier. This interview excerpt dives into artificial intelligence, zero-emission vehicles, and tips to make sense of it all.
Read More →
There's an amazing amount of new technology for trucking out there. For fleets, the challenge is figuring out what’s real, what’s hype, and what’s worth investing in.
Read More →