

Spot Freight Index Shows Unusual Strength in January
Reaching the highest-ever volume for the month of January, the DAT North American Freight Index increased 42% last month compared to January 2012. Freight volume was unusually robust for the season, exceeding December levels by 24%

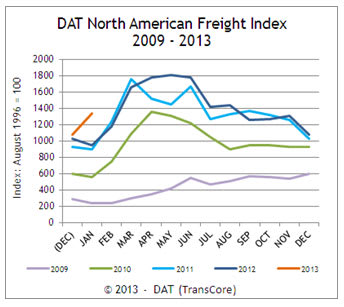
This is the first time DAT's Spot Freight Index has shown an increase in freight availability from December to January.

Reaching the highest-ever volume for the month of January, the DAT North American Freight Index increased 42% last month compared to January 2012.
Freight volume was unusually robust for the season, exceeding December levels by 24%. This is the first time the Freight Index has shown an increase in freight availability from December to January. Over the past 10 years, there has been a 13% average decline in freight levels between those two months.
The DAT North American Freight Index is a measure of spot market freight availability in the U.S. and Canada.
Seemingly Contradictory Market Activity
Several things contributed to the seemingly contradictory market activity reflected in the DAT North American Freight Index in January — that is, a big increase in the volume of freight without a corresponding rise in rates.
"According to Mark Montague, DAT's industry pricing analyst and chief market-watcher, extraordinary things are happening with higher levels of exports to Brazil, China, and Mexico," explains David Schrader, senior vice-president of DAT's freight-matching business in Portland, Ore. "Much of this export freight is industrial freight, which tends to be spot-market freight.
"Also, according to industry reports, the 'contract marketplace' — i.e., freight shippers directly contracting loads out to carriers — shrank by 2.5% in January. This would have forced capacity into the spot market, which, while robust, is smaller than the contract marketplace. The net-net of all this is that loads as well as trucks (capacity) greatly increased on the spot market in January."
The net impact on spot market rates through most of January was negative, as the excess capacity in the marketplace competed for available loads. When it comes to contract rates, shippers appeared to be cautious about committing to higher contract rate volumes due to conflicting signals about consumer demand, Shrader says. "Additionally, when fuel prices increased recently, carriers realized the need to adjust pricing. That is contributing to higher fuel surcharge numbers (calculated) in most regions of the U.S, with the result that the overall net rate rising."
Mismatched Demand and Capacity
It's no unheard of for the spot market to grow even while freight volume is contracting, Schrader says. "The spot market often absorbs the effect of a mismatch between demand and available capacity in the larger freight market," he explains. "This mismatch can occur because of unexpected or large-scale changes in the freight marketplace or even in the economy. Specific markets, regions, and/or equipment types may be affected disproportionately, or there may be a broad trend among shippers to respond to economic conditions in a certain way." On a month-over-month basis, the unusual trend in freight availability affected the three major trailer types to differing degrees: van loads increased 16%, refrigerated freight volume increased 14%, and flatbed freight availability rose 28%. Compared to January a year earlier, freight volume increased 36% for vans, 32% for reefers and 7.9% for flatbeds.
Despite strong freight volumes, truckload capacity remained relatively loose in the spot market, so rates followed a somewhat typical seasonal pattern of a January decline that was most significant for vans and flatbeds. Van rates dropped 2.4% and flatbed rates slipped 2%, not including fuel surcharges. Reefer rates remained stable in January compared to December. On a year-over-year basis, van rates declined 2.4% and flatbeds lost 5.7%, while reefer rates rose 8.6%.
Meanwhile, Schrader says, February data is shaping up as you might expect in a dynamic market. DAT is seeing increased demand regarding spot freight plus tightened capacity, contributing to a rise in the line-haul rate.
Looking ahead to March, DAT believes the best combination of load volume and a favorable ratio of outbound loads should be found in Ohio, Illinois and Indiana in the Midwest, as well as in the Southeastern states of Georgia, North Carolina and Alabama.
More Drivers
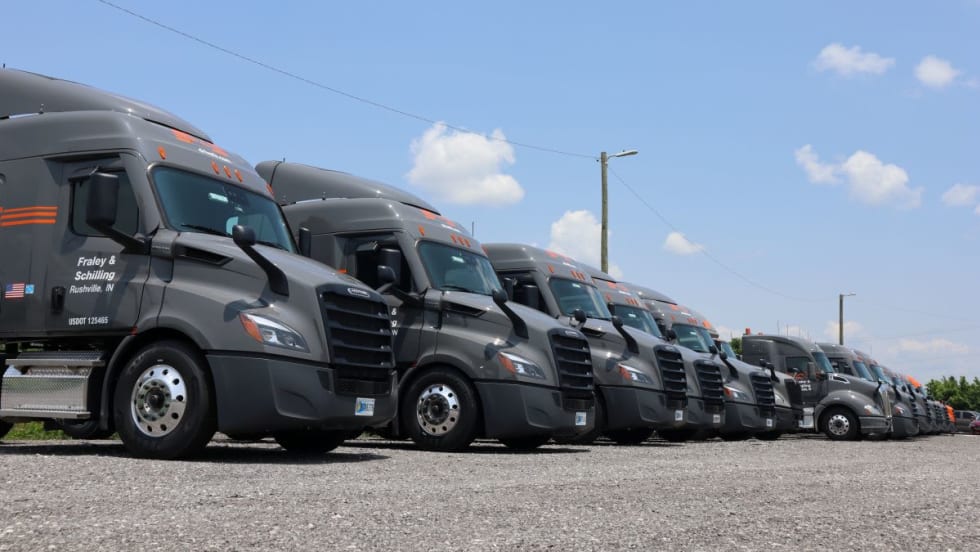
How Fraley & Schilling Improved Logbook Compliance by Over 50%
Fraley & Schilling needed a way to close a compliance workflow gap in its ELD system without adding more work from driver training, reminders, and back-office follow-ups. It found the answer in a custom driver app.
Read More →
Volvo Goes Gaming
Volvo has roared into American Truck Simulator with two new flagship trucks.
Read More →
What the Best Fleets to Drive For Teach About Driver Retention
Survey fatigue, AI-powered routing, owner-operator expectations, and the decline of social media all emerged as themes from this year's Best Fleets to Drive For program.
Read More →
Driver Retention Lessons From the Best Fleets to Drive For
What separates trucking's best workplaces from the rest? Jane Jazrawy shares the biggest lessons from this year's Best Fleets to Drive For program on driver retention, communication, AI, and workforce trends on the HDT Talks Trucking podcast.
Read More →
Farewell, CDL: Why I'm Giving Up My Commercial Driver's License
After more than 20 years as a CDL holder, HDT Executive Editor Jack Roberts is letting his commercial license expire. Not because he wants to — but because trucking's nuclear verdict crisis has made the risks of public-road test drives too great for editors, manufacturers, and everyone involved.
Read More →
How Top Trucking Fleets Improve Driver Retention [Video]
What do healthy snacks, optimized routing, and just picking up the phone have in common? They're all strategies the Best Fleets to Drive For are using to retain truck drivers.
Read More →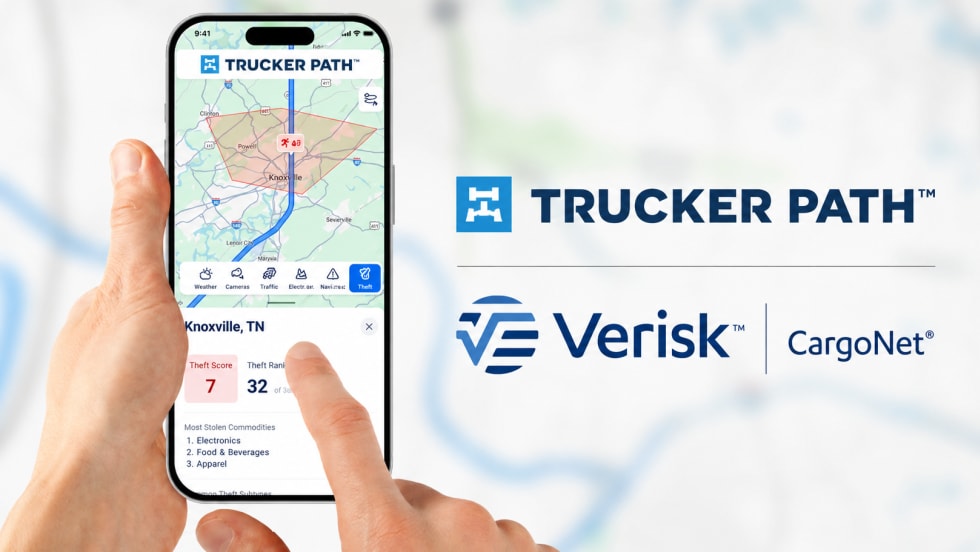
Trucker Path Adds Verisk CargoNet Theft Data to Navigation Platform
Trucker Path’s new cargo theft risk overlays give drivers and fleets visibility into high-risk areas, stolen commodity trends, and theft hotspots.
Read More →
Netradyne Intelligence Uses New AI Agents to Automate Response to In-Cab Camera Data
The company called the next-generation in-cab camera safety platform "a fundamental shift from systems that report on what happened to systems that actively drive what should happen next."
Read More →
Why Truck Detention Keeps Costing Fleets Time and Money
A 2024 ATRI study found detention affects nearly 40% of truckload stops and costs the industry more than $15 billion annually. Despite the toll on drivers, fleets, and supply chains, the problem remains stubbornly persistent.
Read More →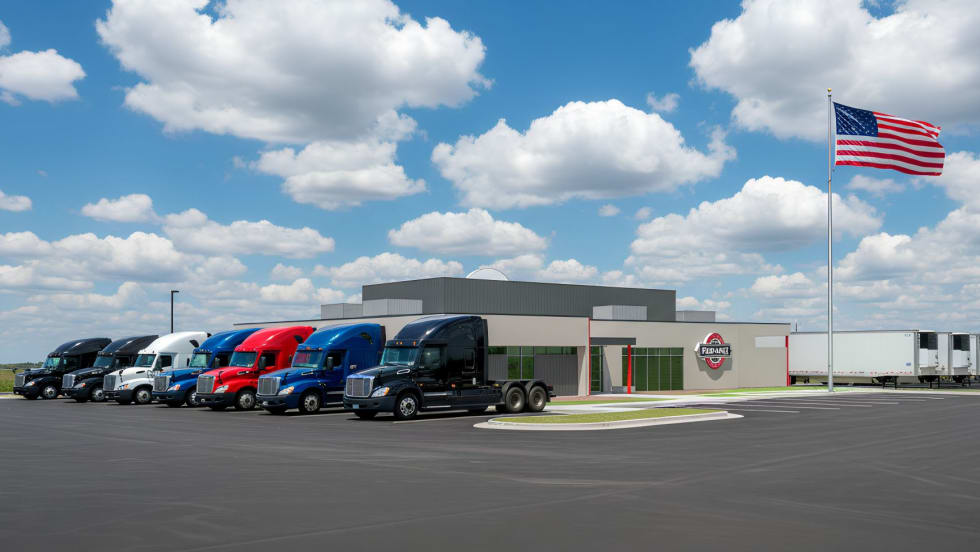
Prime Inc. to Open $7.9M Flagship Used-Truck Dealership
A new driver-focused facility to sell Prime Inc's used trucks and trailers will be the first purpose-built location in the company's history.
Read More →