


Related: Making Data Work for You
Digging into Fleet Data Unlocks Greater Efficiency and Profitability
Going beyond canned reports and digging deeper into your fleet data is the key to unlocking the doors to greater efficiency and profitability.
January 12, 2018

Once you’ve mastered the basics of analyzing data, go beyond canned reports to unlock the doors to greater efficiency and profitability.
10 min to read

P&S Transportation has always been data-driven, but the tools available today make it much easier for people throughout the organization to gain valuable insights from data without being IT experts, says Mauricio Paredes, vice president of business technology for the Birmingham, Alabama-based 1,300-truck flatbed carrier.
Generating reports from data can help provide business-critical information to fleets of all types and sizes, but such reports can be frustrating to compile and tedious to set up. Creating layouts with trends and graphical information can also be time-consuming. And static reports only give one dimension of data.
Peredes says the canned reports offered by most transportation management software only go so far. That’s why it’s important to move beyond traditional data analysis into what’s called business intelligence, or BI.
“If you want to see a particular number by a different dimension, a different qualifier, BI tools allow you take a number and slice it by other dimensions,” Paredes says. “So we were able to take tractor revenue number and slice it by dispatcher, for example, so it made it much easier to follow people’s hunches about why a number was the way it was.”
P&S uses McLeod Software’s products, including McLeod IQ, which gives customers the ability to access and analyze data from its LoadMaster, PowerBroker and other software using Microsoft Excel or other popular reporting tools.
“Canned reports, they give you a snapshot in time of what’s happening,” says Jonathan May, director of business intelligence at McLeod Software. “But we wanted to be able to provide trends, do analysis; you can make forecasts looking at previous historical trends. Those kind of things.”
As the company describes it, McLeod IQ “uses the Microsoft Business Intelligence stack to create a multidimensional cube that aggregates all of the customer’s important metric data in a way that is easier than ever to understand, report, and analyze.”
McLeod IQ also provides access to the company’s data warehouse for users to pull in other data sources that may not be part of their McLeod system, such as the information from their mobile communications and maintenance systems.

Think cubic
Enter “data cubes.” A data cube is a multi-dimensional array of values, used to represent data along some measure of interest. Paredes explains that this allows you to rotate the numbers in different ways and see what it means for your operation.
For example, he says, you might run a report from your TMS on revenue by tractor. “What if we want to follow that number all the way to the dispatcher involved?” he asks. In a traditional TMS, he says, “you would have to take this report and try to manipulate it a lot of ways. Tools like Power BI and McLeod IQ allow you to look at the same number with all these different dimensions as a way of further looking at what affects that revenue.”
When you do that, he says, you might discover that a truck that was producing lower-than-usual revenue had a different dispatcher or a different driver than usual. “Having different ways of looking at the data might indicate a problem with operations or with the driver or with the equipment itself,” he says. “Having that flexibility would allow you to follow the trail of the data to the root cause of why the data changed. You’re always looking for your data to help you in figuring out what’s going on in the real world.”
Another example is maintenance. A traditional report would give you downtime per tractor. “What if you could now split that downtime by what type of issues were keeping that tractor down and what models were having that downtime? Now you might find that Brand X is more likely to have downtime around this particular maintenance issue, so then you can act,” Paredes says. “The tools themselves don’t tell you what to do, but the data is not telling you where to act. Now you can be more preventive around that particular issue.”
Challenge assumptions
Data can also help you learn whether the things you assume are true, actually are.
Daren Lauda, general manager of Teletrac Navman North America, cites a recent example from a customer. Based on the number of warnings coming from the in-cab technology, he says, the fleet thought a particular driver was the worst in the fleet. But a closer look at the data showed that nearly all of those warnings were coming on a very specific curve within a half-mile of the fleet’s facility. “When they actually looked at the data, they realized it wasn’t that much of a problem at all.”
Looking at a broader example, when Minnesota-based Kottke Trucking decided a couple of years ago to get more insight into its operation with TCG’s Activity-Based Costing and Profitability Management Tools, it was eye-opening, says General Manager Kyle Kottke. “My assumptions about what was winning and losing weren’t as accurate as I had assumed they would be. Particular lanes I assumed would prove to be merited as a cornerstone of our business got altered and changed” when it became evident they were not as profitable as once thought.
Costing software like TCG works with existing TMS programs to allow fleets to drill down into data and analyze profitability, reorganize freight lanes, focus on operations, and give customers justification for rate changes.
Tom Poduch, director of logistics design for Transervice, says analyzing data relative to truck speed led the team down some interesting paths. The New-York-based company owns, operates, and manages more than 24,000 pieces of equipment from 126 locations in its full-service leasing and dedicated contract carriage business. It has used onboard computers and the data they can provide for a long time.
The conventional wisdom, Poduch explains, was that driving at faster speeds would waste fuel. But when they crunched the numbers, they discovered that drivers could safely travel a little faster on cruise control without sacrificing fuel efficiency. And beyond that, they started using that data to evaluate whether they actually had the best truck specs for their operation.
“How much engine load are we physically using? Do we really need a 450-hp motor, or could you accomplish the same thing with 395 hp and different gearing, maybe better aerodynamics?” Poduch says.

Find hidden opportunities
While you may want to start with the simple things, the low-hanging fruit that can move the needle (to mix a few hackneyed business phrases), there are gold mines hiding in the data once you start digging.
For instance, McLeod’s May says many fleets have traditionally looked at revenue per mile, “but is that really what’s driving your business? That answers nothing about the expense side of things. You don’t know if you’re getting the best rates, the best customers, things like that. There’s so much more than revenue per mile.”
Pete Allen, chief client officer for MiX Telematics, says in his experience, one area fleets should look at is asset utilization. A fleet may not actually realize that 5% of its 100 trucks aren’t really being used. “Maybe they could remove that 5% and get a pretty significant cost reduction.”
A couple of new measures that have started to gain popularity in the last few years are velocity-distance and velocity-revenue, May says. Velocity-distance is the average mph from when a truck picks up a load to when it delivers it. If you have a load where the average was 20 mph, he says, you might decide that it would make more sense to take a different order that averages 50 or 60 mph, because it’s more efficient utilization of your equipment. Velocity-revenue is the revenue per hour from when the load is picked up to when it’s delivered – how much money is that truck making per hour on that load?
“You’ve got to start thinking about, not only, is it profitable from dollars and sense, but from [the aspect of], this lane might take twice as long to deliver, so I’m losing capacity or the ability to take other loads.”
Another metric May says has been helpful is something McLeod calls momentum. This tracks each status change of an order in the system, from when it’s placed to when it’s delivered to when it’s billed, etc., and how long each step takes. “One of our customers, Barton Logistics, said, ‘I’ve got a problem but I’m not sure where it exists.’ Once we started mapping these out for him, [we found out] it was sitting in billing for over five days before anyone did anything with it. So you’re missing out on cash flow at that point.”
Chris Henry, program manager for the Truckload Carriers Association’s InGauge program, says gross margin is a metric commonly used in other industries but not yet popular in trucking. That’s changing, he says, and it’s a metric that InGauge has been focusing on with its data benchmarking program.
In broad terms, gross margin is the difference between revenue and cost of goods sold, divided by revenue, and expressed as a percentage. It doesn’t include indirect fixed costs like office expenses, rent, or administrative costs.
Gross margin can help businesses determine how much of the revenue generated by the company results in profits rather than going toward covering costs. The higher a company’s gross margin, the more efficiently the company operates.
But what exactly goes into the “cost of goods sold” can vary, and trucking operations don’t fit neatly into models designed for retail or manufacturing businesses.
“I think the problem is standardization,” Henry says. “If you go to 10 different trucking companies they’re going to have 10 different definitions of what are variable costs [a key component of COGS] and what aren’t. By putting our foot down as a group and saying these are what we consider variable costs, you have the standardization and have a way to compare yourself.”

Look outside your company
Analyzing your own company’s internal data can only take you so far. In addition to the benchmarking we covered in Part 1 (see December 2017 issue, page 54), there’s other outside data you can take advantage of, explains Tim Leonard, executive vice president, operations and technology for TMW Systems.
“I think you do need enterprise business intelligence data to truly see where I compare,” he says. “It’s not that difficult any more. Five years ago, very difficult. I think it’s just a learning lesson that there is a lot of data that’s free out there that you can get and do some of this work yourself.”
For instance, he says, TMW is working with fellow Trimble company PeopleNet to analyze what drivers say on social media.
“Drivers aren’t always going to say things inside the company,” he says, but they may say them on Facebook or Twitter or LinkedIn. By using auto APIs on Twitter, for instance, and similar tools on other social media platforms, “We can watch 100,000 to 200,000 related drivers through social media,” he says. “We don’t capture their names, but try to capture trends around the words ‘hate’ or ‘dislike’ or ‘love’ working for this company. We can do better driver profiling.”
They also track phrases relating to job satisfaction, such as home time, better pay, more responsibility. “One area that surprised us a little was recognition for doing a good job. Getting more recognition, they’re proud to be a driver, the company is proud of their drivers.”
Other examples of outside data include weather, traffic, and safety scores.
Keep at it
Whether you’re just dipping your toe into data analytics or looking to move to the next level of business intelligence and big data, perhaps you can look for inspiration to the Nike slogan, “Just Do It.”
“If you haven’t looked into what BI can do for you, look into it,” Paredes says. “The tools now have gotten much simpler to use. The cost of entry is much lower, so your return on investment is much shorter. There’s so much information out there now that can help. You don’t need to be an expert or hire an expert; you can just start playing with the data yourself.”
And as TCA’s Henry adds, “The longer you progress, the more resources you put into it, the more you should get out of it.”
Subscribe to Our Newsletter
More Fleet Management
Sponsored•July 1, 2026
Enhance Fleet Performance with High-Efficiency Auxiliary Power Units
Drive sustainable cost savings while increasing driver comfort during short- and long-haul logistics operations.
Read More →
Sponsored•June 30, 2026
Is Your Parts Procurement Process Reactive or Proactive?
Ready to revamp your parts procurement process? Learn how now with “Strategic Parts Purchasing: A Process Checklist”
Read More →
What Trucking Events are Happening in 2026?
Looking for trucking-related conventions, expos, and other events? Heavy Duty Trucking has developed this list of national and larger regional trucking shows and events.
Read More →
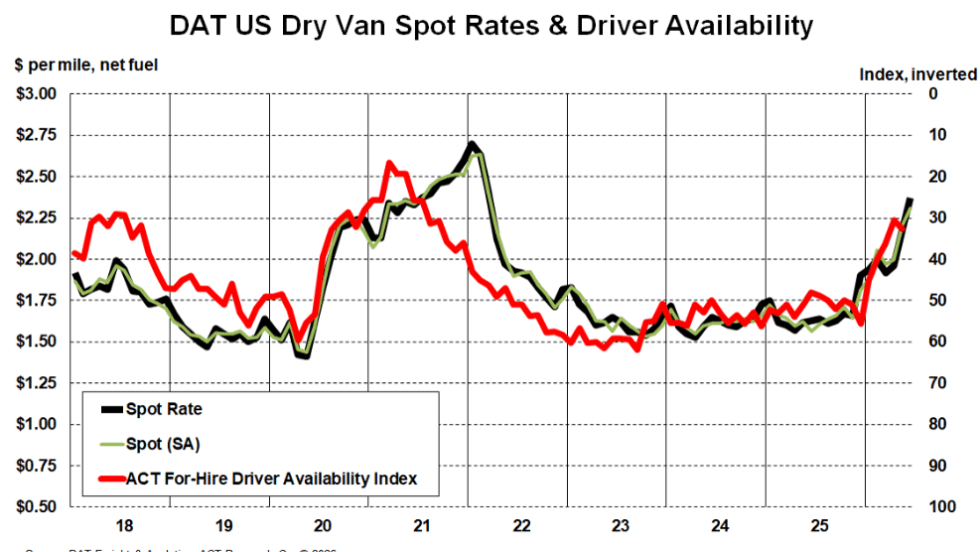
Truckload Rates Keep Rising as Tight Capacity Fuels Freight Market Recovery
Spot and contract rates continued climbing in May and June, not because freight demand is surging, but because fewer trucks and drivers are available.
Read More →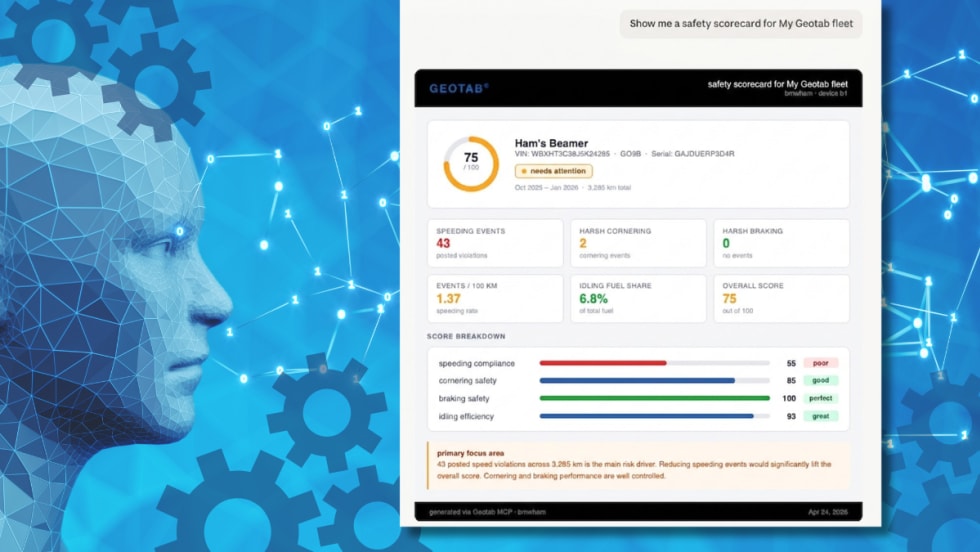
What Geotab's New AI Connector Means for Fleets
Fleets can now ask their usual AI assistants questions about maintenance, safety, fuel use, and vehicle performance, using their live Geotab data, and take action on the answers without leaving their preferred AI tool.
Read More →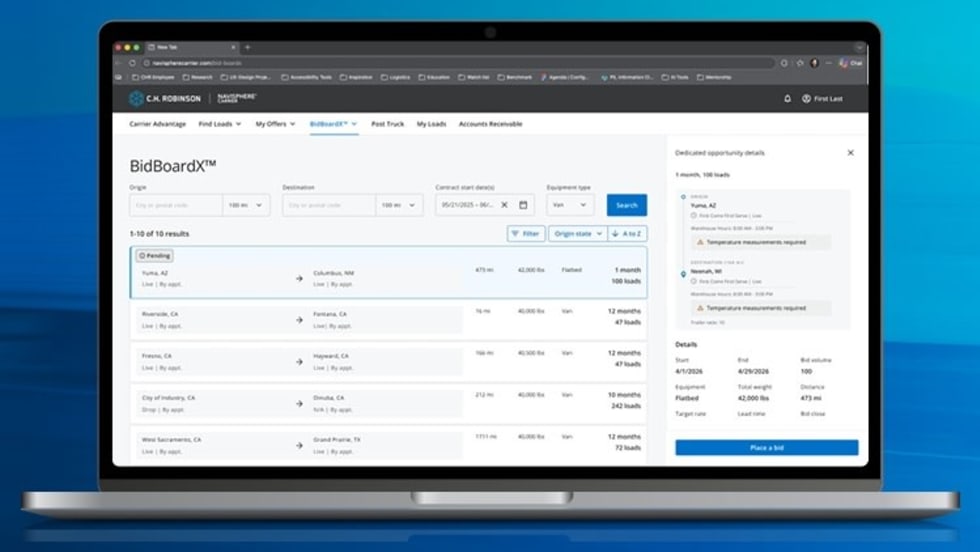
New C.H. Robinson Tool Opens Door to More Predictable Freight
BidBoardX lets carriers search, bid on, and secure committed freight opportunities through a single digital marketplace.
Read More →
New York City's Microhub Project is Delivering Results
Trucking, last-mile delivery companies, and environmental advocates like what they are seeing so far with New York's microhub program.
Read More →
Why Truck Detention Keeps Costing Fleets Time and Money
A 2024 ATRI study found detention affects nearly 40% of truckload stops and costs the industry more than $15 billion annually. Despite the toll on drivers, fleets, and supply chains, the problem remains stubbornly persistent.
Read More →
Time is Running Out to Apply for Exclusive HDT Event
Heavy Duty Trucking Exchange brings fleet managers and suppliers together for the deeper conversations that lead to ideas, partnerships, and solutions. Time is running out to apply for the September event.
Read More →
Amazon Launches Less-Than-Truckload Freight Offering for All Businesses
This launch is the latest addition to Amazon Supply Chain Services, a portfolio of supply chain capabilities from Amazon, including freight, distribution, fulfillment, and parcel shipping.
Read More →