

Analysis: Freight Payment Index Offers Helpful Regional Benchmark
If you want to know how your trucking operation is stacking up against other freight shipping businesses, there is a new barometer available, U.S. Bank's Freight Payment Index, and it offers some features that have not been seen before, says business contributing editor Evan Lockridge in his December Hotline column.

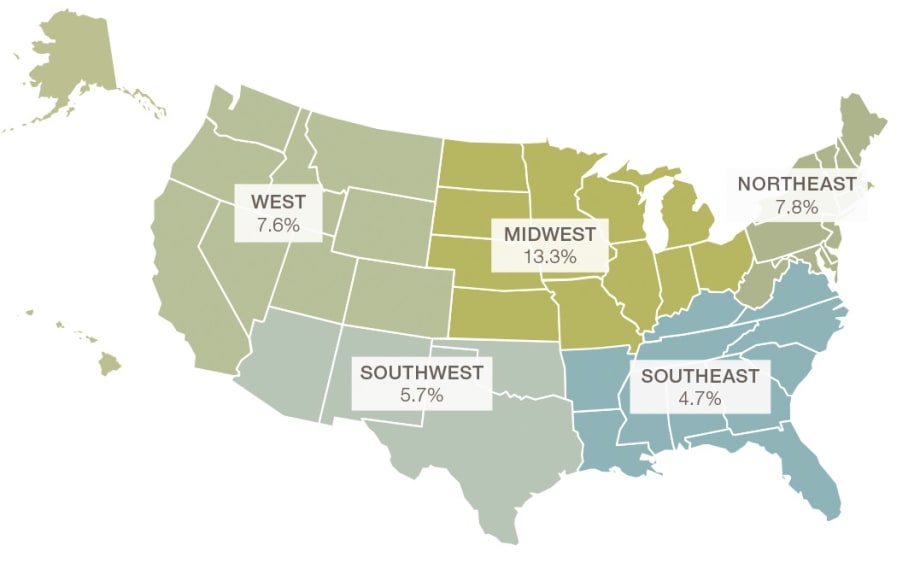
Regional quarter-over-quarter % change in spending. Source: U.S. Bank Freight Payment Index

If you want to know how your trucking operation is stacking up against other freight shipping businesses in the country, there is a new barometer available, and it offers some features that have not been seen before.
That was the message from U.S. Bank during the American Trucking Associations’ annual Management Conference & Exhibition in Orlando in October as it announced its new quarterly Freight Payment Index – which actually is two indices.
One measures changes in shipment activity. The other is a gauge of changes in freight spending activity. Both are based on data processed through U.S. Bank Freight Payment, which processes around $23 billion annually in freight payments for some of the world’s largest corporations and government agencies. (You can see the latest report online at www.freight.usbank.com.)
What makes this new gauge unique are two things: One, it breaks the data down into five U.S. regions, based on the state of origin for a shipment. And two, the analysis features commentary from Bob Costello, chief economist from the ATA and one of the most respected people in the field of analyzing both trucking and economics.
This first snapshot revealed just how much things can vary regionally.
For instance, the Northeast region saw the biggest gain in shipments, up 10% in the third quarter from the second quarter. It was helped by better manufacturing activity and slightly higher housing starts.
In sharp contrast, shipments in the Southeast, where activity is usually strong, saw just a 0.1% increase as Hurricane Irma disrupted the supply chain, following a 3.9% second quarter gain. However, at the same time freight spending jumped nearly 4.7% as truck capacity tightened as a result of the storm.
The Midwest led all other regions in overall freight spending, jumping 13.3% from the second quarter to a record high, due in large part to a rebound in general manufacturing activity.
Making the West impressive wasn’t just a 6.8% increase in freight shipments or the 7.6% gain in spending over the second quarter, but rather the 12.8% year-over-year jump in shipments, likely helped by better West Coast Port volumes.
Lastly, the Southwest, which includes Texas, saw shipments increase 3%, slower than the 5.3% gain in the second quarter, but considering it was during Hurricane Harvey it was remarkable. This region will likely get a significant boost when the rebuilding gets into full swing, according to the report.
Why are these regional differences so important? “Freight shipments are generally not uniform across the country,” Costello said, noting the index “gives a good snapshot into the differences in economic climate from one end of the country to the other.”
Let’s also not forget the big national picture, which showed freight spending increased 8.3% in the third quarter, the largest quarterly gain since the final quarter of 2014, while the shipment index improved 3.3%. That’s slower than the 5.8% surge in the second quarter, but still solid.
Looking at all of these changes can be helpful for benchmarking your company’s performance against others. And with the historical data going back to 2010, it can give you and your business a real sense of trends over time.
And the good news, judging from this report, is that conditions for trucking and the economy were good in the third quarter. Barring any sudden jolts, it will likely be at least as just as good as this current quarter wraps up and as we say goodbye to 2017 and greet a New Year.
More Fleet Management
How Innovative Trucking Leaders Turn Change Into an Advantage
As the pace of change accelerates in trucking, the fleets that adapt best have more than the latest technology. They have cultures that embrace improvement.
Read More →
Freight Broker Bonds Just Got Harder to Get. Here's What That Means for Your Fleet.
When it gets harder for a freight broker to prove they are financially sound, the ones who cannot clear that bar get pushed out of the market. And those are exactly the brokers who used to leave motor carriers holding the bag.
Read More →
Long-Awaited Canadian Border Bridge to Open in Detroit
For trucking, the bridge opening should offer immediate improvements in efficiency and reliability, with new customs facilities, expanded inspection capacity, and direct freeway-to-freeway connections.
Read More →
Aurora Rolls Out Next Generation of Driverless Trucks for Commercial Freight
Aurora's latest autonomous trucks it's rolling out with International feature lower-cost hardware designed for a million miles as the company expands commercial driverless freight operations across the U.S. Sun Belt.
Read More →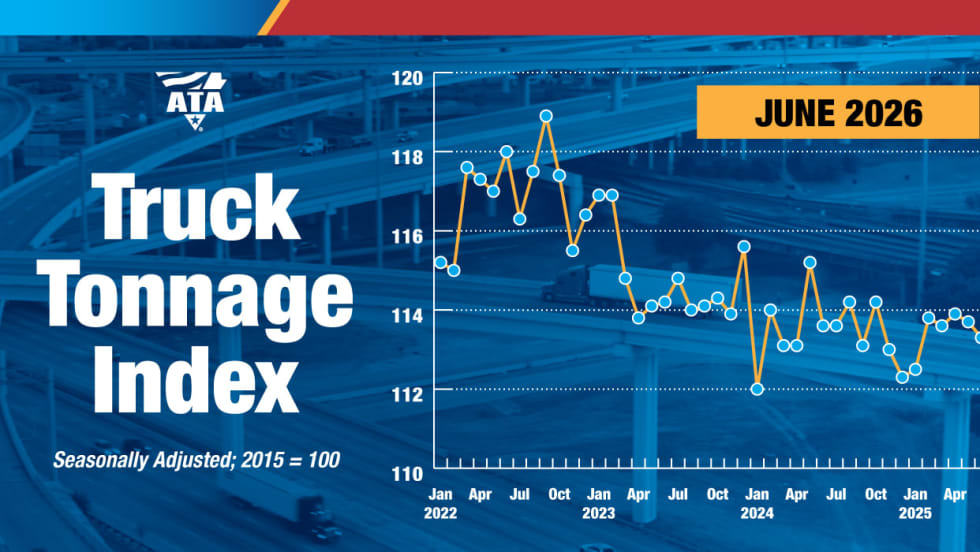
Freight Tonnage Down, Rates up, as Lower Capacity Powers Trucking Recovery
The recovery from the freight recession continues to be driven by reduction in capacity rather than by increased demand.
Read More →
Think Your Trucking Fleet Isn't Using Much AI? Think Again
Shadow AI — the use of unauthorized artificial intelligence tools at work — is becoming increasingly common, putting sensitive company data at risk. Learn how trucking fleets can protect sensitive data while embracing AI.
Read More →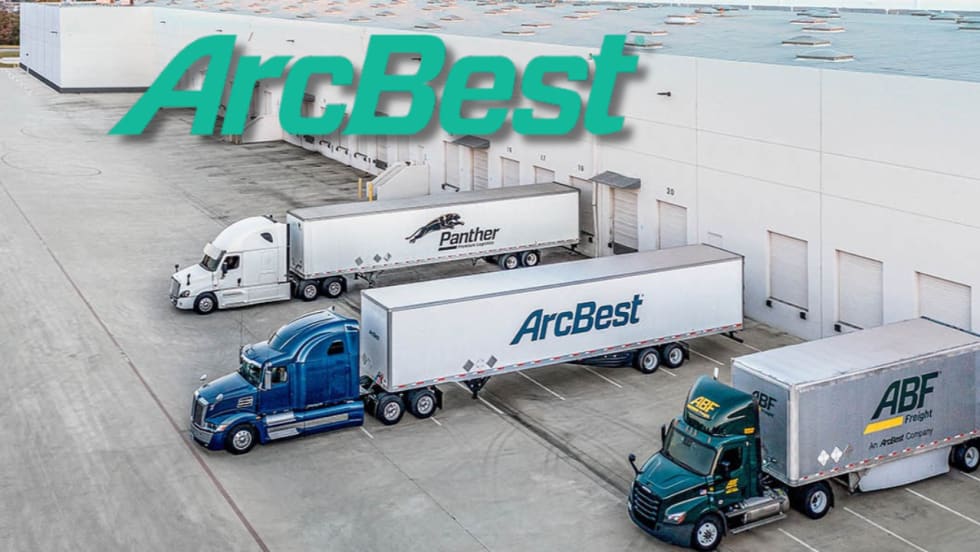
ArcBest Consolidates Brands, Cuts Workforce
The company will bring three business units under the ArcBest brand, eliminate about 2% of positions, and expects the changes to generate $40 million in annual savings.
Read More →
Trucking Fleets Faced Record Operating Costs During Third Year of Freight Recession
ATRI's annual operational cost report shows carriers trimmed fleets, delayed equipment purchases, and ran older trucks as expenses continued to outpace freight rates.
Read More →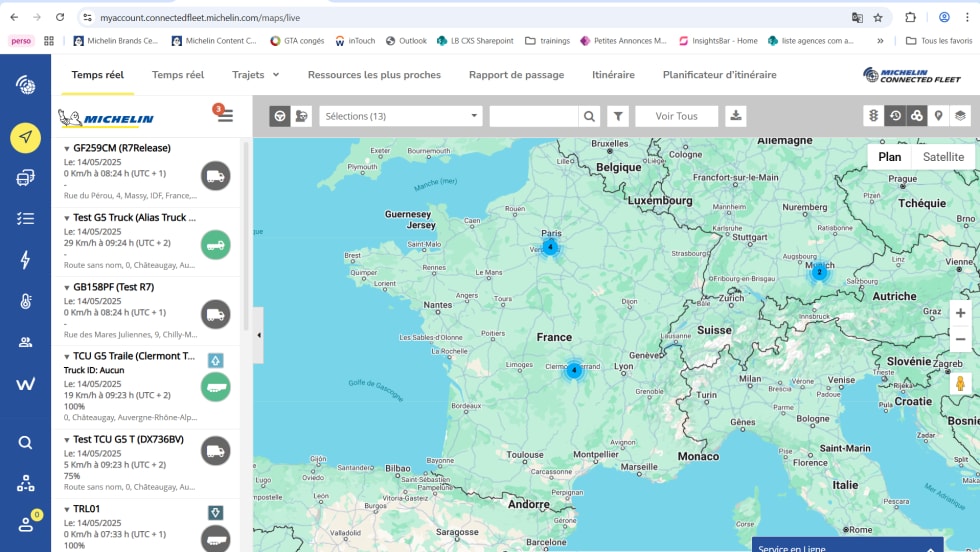
Michelin Adds AI Assistant to MyConnectedFleet Platform
Michelin’s new generative AI tool delivers instant fleet insights, helping managers analyze fuel use, tire maintenance, vehicle status, and operational performance without manually creating reports.
Read More →
LytxOne Platform Now Features AI, Compliance, and Asset Tracking Tools
New enhancements add AI-powered insights, asset tracking, compliance automation, and configurable privacy controls to Lytx's all-in-one fleet management platform.
Read More →